February 11, 2020

At this writing, corn can be forward contracted for harvest delivery in Perryton, Texas for $4.02 (CBT Dec Corn +10 cents). In Medford Oklahoma, the corn harvest forward contract price is $3.62 (CBT Dec Corn –30 cents). Since wheat can be forward contracted for $4.64 (KC July –20 cents) in Medford and $4.52 (KC July –30 cents) in Perryton, corn prices would need to increase 50 to 60 cents to provide support for wheat prices.
Since USDA/NASS inconsistently reports the Oklahoma monthly average corn price, Perryton and Texas prices will be used here. Currently, Texas corn prices are about 40 cents higher than Oklahoma corn prices.
The seven-year (2013 through 2019) average August and September corn price for Texas is $4.03. Monthly average prices during 2013 through 2019 ranged from $3.35 (February 2017) to $5.46 (August 2013). The August and September monthly price ranged from $3.39 (August 2016) to $5.46 (August 2013).
See, How changes in ending stocks affect seasonal price pattern
The 2013 through 2019 August and September average price ($4.03) indicates that the current forward contract price is nearly equal to the 2020 corn harvest forward contract price. This situation indicates that there is a 50% chance of higher prices with a peak price of $5.46, and there is a 50% chance of lower prices with a minimum price of $3.35.
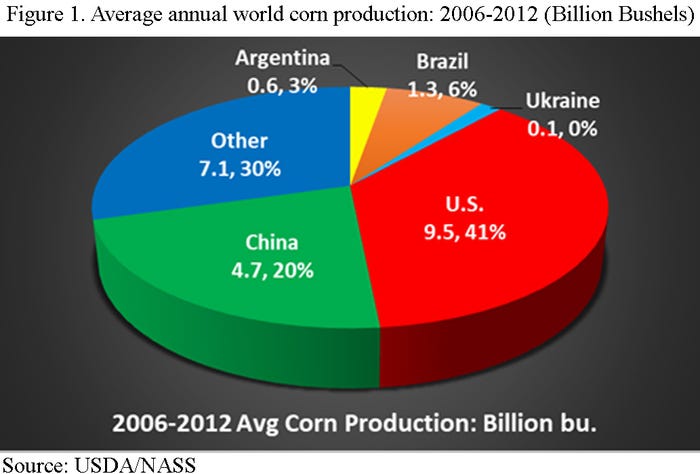
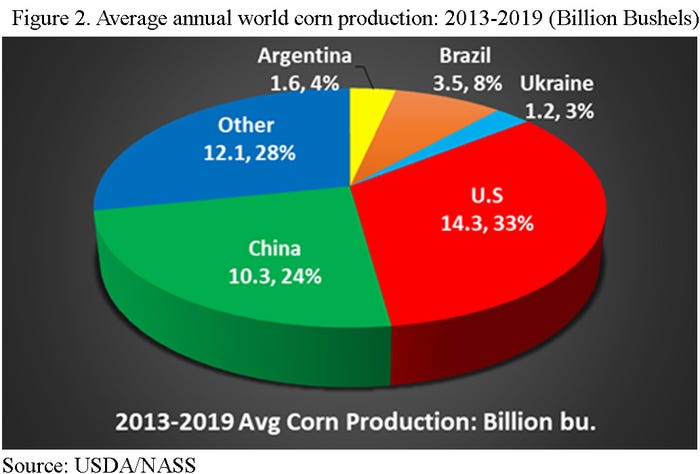
Between the 2012/13 and the 2013/14 corn marketing years, nearly every supply and demand factor increased. Average annual corn production for the seven years 2006 through 2012 was 32.7 billion bushels (Figure 1). For the production period 2013 through 2019, corn production averaged 42.3 billion bushels per year (Figure 2), which was a 9.6 billion bushels (29%) increase in production.


The seven-year average annual world corn use increased from 32.4 billion bushels in 2006 through 2012 to 41.4 billion bushels during the 2103 through 2019 period for a 9.0 billion bushels (28%) increase.
The Texas average annual corn price for the 2006/07 through 2012/13 marketing years was $4.97 compared to an average annual price of $4.21 for the 2013/14 through 2019/20 marketing years.
The good news is that, during the last three marketing years, world corn use has averaged 700 million bushels per year greater than production. Both world ending stocks and the stocks-to-use ratio have declined. Lower ending stocks and the stocks-to-use ratio resulted in slightly higher prices ($3.71 to $4.16).
If the three-year trend continues, with use increasing slightly faster than production, 2020/21 marketing year Texas corn prices could average $4.25. Since corn prices tend to increase about 28 cents during the marketing year ($4.03 in August to $4.31 in February), the forward contract price of $4.02 is in line with this analysis.
Another factor that should be considered is that between 2013 and 2019 (using the 7-year averages), Argentina’s corn exports, as a percentage of world corn exports, increased from 15% to 18%; Brazil’s exports increased from 14% to 19%; and Ukraine’s exports increased from zero to 15%. These three countries’ exports, as a percentage of world exports, increased 23% (29% to 52%).
Twenty-three percent of the world’s 6.56 billion bushel corn exports is 1.5 billion bushels, which is 1.5 billion bushels of corn the U.S. will not export.
Unless the 2020 U.S. corn production is well below expectations, corn prices are not expected to support wheat prices.
About the Author(s)
You May Also Like


