Anyone predicting markets does so at their peril. So, as us “experts” trot out projections for USDA’s first real corn and soybean production forecasts due Aug. 12, Wall Street provided yet another reminder of the limits of prognostication.
On the heels of 40-year inflation highs and a second big Federal Reserve interest rate hike, another shoe dropped on the stock market last week. U.S. Gross Domestic Product fell for the second straight quarter, bucking economists’ hopes for an increase. While two consecutive quarters of GDP declines meets some technical definitions of recession – and this time stagflation at that – stock markets kept on rallying.
Indeed, “go figure” might as well be the market’s motto right now. With that caution in mind, there are signs grain markets are trying to prove an early summer bottom. So here’s what I’m reading in the tea leaves right now for grains, fertilizer, and the dollar.
Weather dents yield hopes
USDA surveys farmers for yield expectations to produce its August forecasts, adding actual sample fields to the mix in September. The agency already cut its corn forecast from 181 to 177 bushels per acre due to slow planting. Preliminary weather data for the first four weeks of July suggests that number could come down again.
Temperatures in key Corn Belt states used in a popular yield model were more than 1.5 degrees above average. While it wasn’t nearly as hot as the scorching seen in drought years like 2012, readings were similar in 2019 and 2020, when corn yields also were below normal.
Precipitation data is harder to read. Satellite imagery suggests average rainfall was bit above normal, despite dry conditions in Iowa, Kansas, Minnesota and Missouri. That plus the heat would trim average yields less than a half bushel.
However, daily weather data from individual stations around the region points to drier totals overall that would trim yields to 173 to 175 bpa, depending on the model used.
Other yield forecasting methods also suggest a cut from USDA is in the offing. With 61% of the crop rated good or excellent, 4% below the five-year average, condition scores translate into yields of 175 to 176 bpa. The Vegetation Health Index for corn, which accurately predicted last week’s drop in weekly Crop Progress ratings, is the lowest of all these methods, though it won’t reach peak accuracy for a couple more weeks.
Soybeans appear to be holding up better than corn, if only because yields are made in August. Yield potential also appears to be fading a bit for beans. USDA stuck to its long-held statistically based forecast of 51.5 bpa in the July World Agricultural Supply and Demand Estimates, though the 20-year trend, or normal, yield is higher at 52.2 bpa. The 59% good/excellent reading for soybeans is 3% below the 5-year average but translates into slightly better than USDA’s yields.
Vegetation Health Index levels for soybeans are tracking ratings and also predict average or better yields.
The weather model for soybeans includes August weather, which currently looks warmer and drier than normal, but nothing like a disastrous drought. Still, yields would be 51.3 to 51.6 bpa depending on the July rainfall data used.
Yields are only half the equation for production. Updated acreage estimates, including new surveys from late-planted states, could swing either bullish or bearish. Big profit potential may have lured more late acres into production, for sure. Still, final planting estimates in January went down around two-thirds of the time since 1965, a big enough difference to be statistically significant.


Charts offer hope
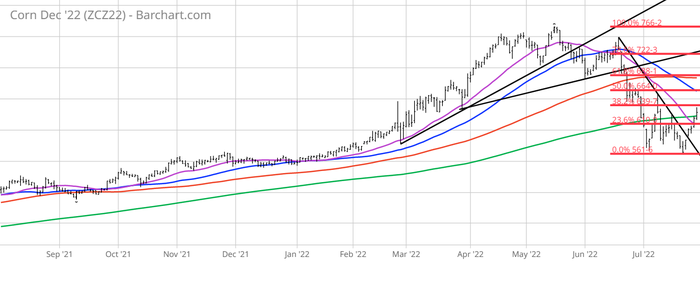
Daily prices charts are also hinting at signs of a bottom after making six-month lows earlier in the month. December corn broke a bearish trendline off June and July highs with a gap higher action last week, also trading above its 200-day moving average. A move through the 38.2% Fibonacci retracement around $6.40 would open the door to the 50-day average and 50% retracement below $6.65 for short-term targets.
Divergence on the relative strength index is also positive. While corn made new lows earlier in the month, the RSI did not. Finally, implied volatility, a measure of nervousness in the market, is also on the rise seasonally.
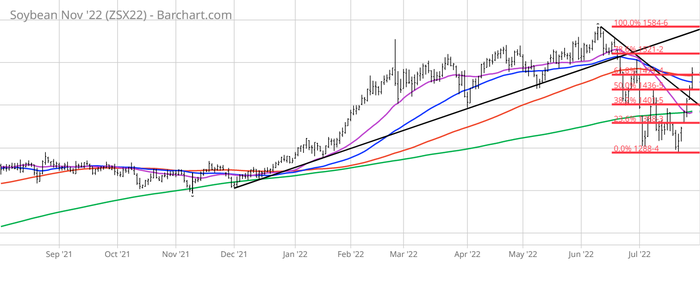
The same technicals are in play for soybeans, even more so. November futures took out trendline resistance, the 61.8% retracement and 50-day moving average last week, with implied volatility matching summer highs. A move past $15.2125 could set up a test of contract highs at $15.8475.
Seasonal patterns for both contracts offer more support. Ability to stay above January lows was a last-ditch attempt to maintain bullish trends that so far has held.
Has dollar peaked?
Corn and soybean rallies must buck headwinds from several directions. In addition to questions about renewed exports out of Ukraine and demand from China’s soft economy, a strong U.S. dollar could dampen prices for commodities denominated in greenbacks.
Recession risk caused the dollar index to pull back from 20-year highs, despite the Federal Reserve decision last week to raise its benchmark short-term lending rate by another three-quarters of 1% as expected. Higher returns for safe havens like U.S. Treasuries tend to lure investors to the currency, but those who bailed on the buck appeared ready to believe “peak dollar” was in the rearview mirror.
Despite that sentiment, the Fed likely isn’t done raising interest rates. The central bank’s target for short-term Federal Funds could increase at least another half of 1% after the next meeting on monetary policy Sept. 20-21. Though more signs of a recession could trigger a pause, inflation doesn’t appear ready to succumb without a fight, if not a Paul Volcker death march.
Even with last week’s slump, the dollar remains at the high end of its trading range since 2002. The U.S. remains the best of a bad lot. Europe’s recession risk is even greater, while the central bank in Japan, where official short-term rates are negative, is only beginning to even talk about its first increase since 2007.
My model of rates suggests the dollar index is fairly valued according to supply and demand factors. So, corn and soybean rallies will have to make do on their own fundamentals.
And that makes USDA’s Aug. 12 numbers all the more important, though they won’t be the last word on the subject by any means.

Gas pains
Blink fast and you might have missed a chance to secure fall nitrogen, and perhaps other fertilizers, for what may be a bargain – or not.
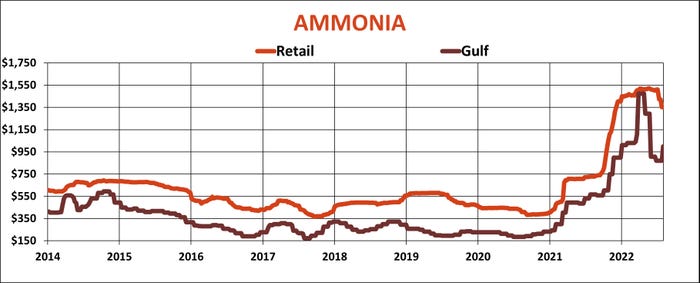
While summer fill ammonia in some places fell to $1,110 or even below $1,000, dealers are likely to pay more for additional fall supplies. After declining from a record $1,475 a ton in April, August ammonia contracts at the Gulf settled some $127 higher, coming in just under $1,000 on a short ton basis.
And U.S. growers don’t have the worst of it, not by a long shot. Prices in Europe are nearly twice as high as plants deal with shortages of natural gas caused by the war in Ukraine as well as near-record food prices.
While EU countries approved emergency curbs on gas usage, Russia resumed flows on a key pipeline at under 20% of capacity. Buyers wasted no time trying to secure whatever N they could for delivery over the next two months amid uncertainty over both supply and demand.
Middle East urea futures for August surged $180 last week to settle at $675, while Gulf urea is $600 or more for fall delivery, Traders are still waiting for word on another big tender out of India and availability of supplies from big exporter China.
Chinese urea exports doubled in June compared to May, but were off 61% from the previous year. Total urea exports this year are down 73%, while year-to-date phosphate shipments are 61% lower.
U.S. retail prices last week did show softness at some locations due to previous pullbacks. Some dealers on the southwest Plains offered urea below $675, $200 below the Corn Belt price. Retail DAP is a little cheaper after the summer reset, but is still averaging around $900, while potash remains stubbornly high due to sanctions on Russia and Belarus.
Perhaps the only good news for growers last month came from the International Trade Council, which rejected anti-dumping tariffs on UAN imported from Russia and Trinidad and Tobago. Tariffs remain on phosphate shipments from Russia and Morocco.
About the Author(s)
You May Also Like


