It’s natural to assign blame when something goes wrong. For the grain market the kid with his arm stuck in the cookie jar was a relatively modest increase in corn planted acres USDA published June 30.
According to the agency farmers planted – or still intend to plant -- 89.9 million acres, 450,000 more than March intentions. The increase wasn’t much, just one-half of 1%. But it was 223 million above the average guess in the trade, even though as I’ve written before, slow planting and huge potential profits made any forecasts difficult, if not impossible. December corn futures broke hard June 30, while more selling took the contract below its 200-day moving average, bringing $6 in sight.
Indeed, history suggests these June numbers are far from finalized. While June tends to see an increase for both corn and soybeans, final planting estimates in January went down around two-thirds of the time since 1965, a big enough difference to be statistically significant. That pattern was also true in years when June increased from March.
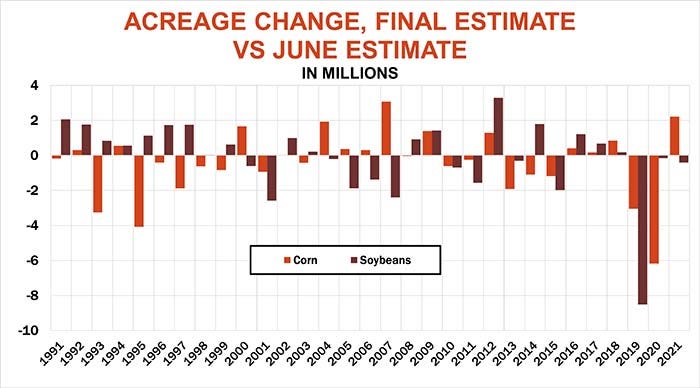
With corn, these changes are driven mostly by planting progress, or lack thereof, though spring conditions don’t appear to affect soybeans nearly as much. Still, bettors appear to be wagering the soybean totals will eventually go higher, too. USDA put June soybean acreage at 88.3 million, a whopping 2.6 million below March prospective plantings. The trade looked for a cut of just 525,000, which initially prompted November soybean futures to rally. That effort fell flat by the close, leaving a bearish reversal on price charts that triggered follow-through weakness and the first close since February below support at $14.
The other data out June 30 caused barely a ripple. June 1 quarterly grain stocks came in within a few million bushels of what I expected, leaving traders focused on acreage and a broader based selloff of many other so-called “risk” assets. Though crude oil showed a little strength, gold dropped below $1,800 an ounce for the first time all year while bitcoin continued its descent into what could be oblivion.
USDA will resurvey states with slow planting, with updates if any released along with the agency’s first survey-based yields estimates Aug. 12. With that debate on hold, the market’s focus as usual ahead of Independence Day turned to weather. Forecasts for the next two weeks are generally warm but fairly wet – just about perfect growing conditions, especially for corn as the crop begins to pollinate.
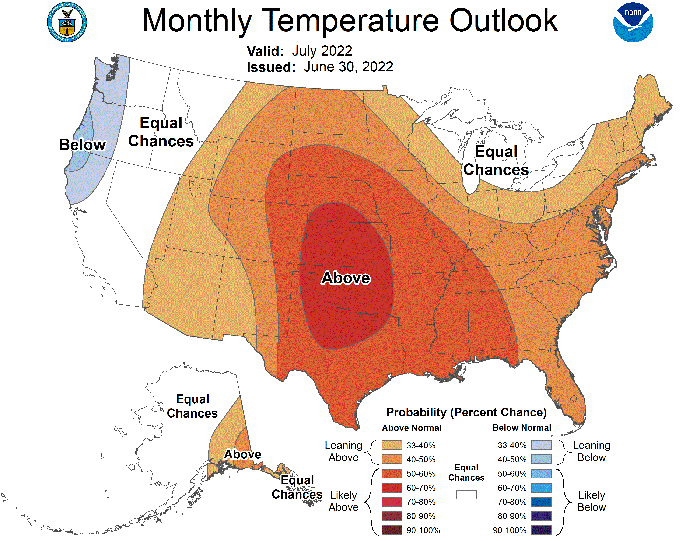
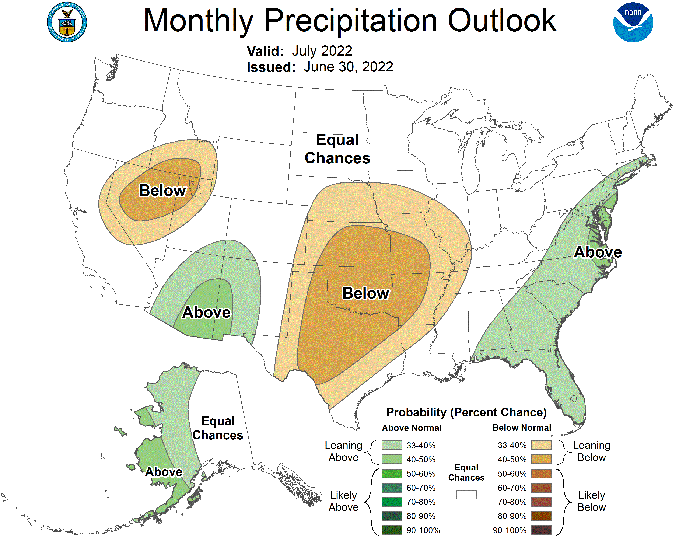
Monthly outlooks for July updated June 30 continued above normal temperatures and showed below normal precipitation focused on the southwest Plains spreading as far east as Central Illinois. But forecasts in key states don’t show any real abnormal conditions overall, at least outside of Kansas. Based on these conditions, a popular yield model puts the corn yield nationwide around 177 bushels per acre – right where USDA estimated the “normal” statistical trend yield after slow May 15 planting progress.
Coupled with the government’s new acreage data, this would produce a crop of 14.5 billion bushels. Assuming some price rationing of demand, the projected surplus left over at the end of the marketing year Aug. 31, 2023 wouldn’t change much from what’s expected to be around at the end of summer this year.
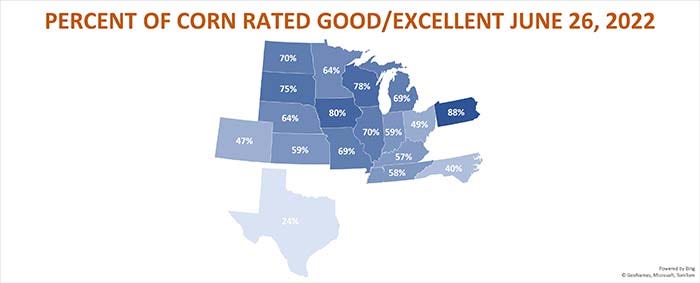
Weekly Crop Progress ratings are even more tranquil. Though they dropped a little over the past couple weeks, the 67% rated good or excellent remains around average, pointing to yields around 178. And if these good early conditions hold through harvest, yields could be 184 bpa or better, enough to swell carryout above 2 billion bushels without a big pick up in demand.
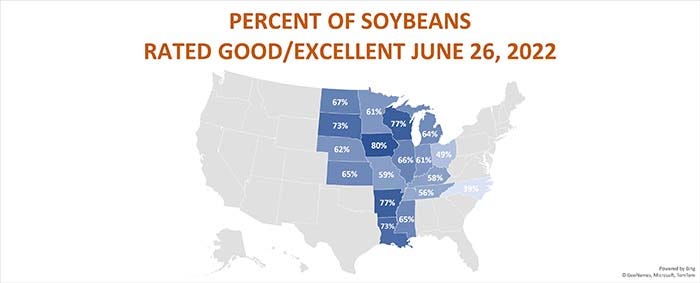
Deducing soybean yield potential this early in the growing season is far from an exact science, if it’s possible at all. The 65% good/excellent rating last week translates into current yield potential between 49 and 53.5 bpa – USDA is at 51.5. If ratings hold through harvest, yields could higher, too, in theory surpassing 54 bpa.
Weather models for soybeans use a combination of July and August weather, but current forecasts are only for July. If July trends hold, yields would be around 51 bpa, enough for a 4.46 billion bushel crop that increases carryout around 50 million bushels. But those bigger yields suggested by the Crop Progress ratings would swell ending stocks Aug. 31, 2023 above 450 million, without a big increase in exports, likely to China.
So, the sell off in the grain market wasn’t surprising, given the data traders were looking at. But there’s another set of conditions that tell a far different story about how crops are faring.
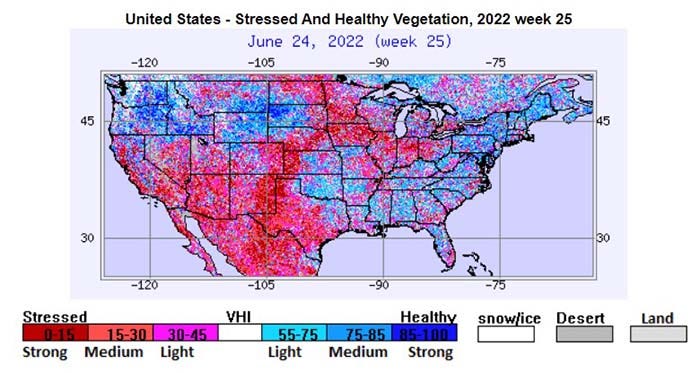
Vegetation Health Index readings for both crops remain distressed, especially in key growing areas, a far cry from the crop ratings. Corn indexes are 20% to 40% below average, which translates into yields below 160 bpa. Soybean indexes show nearly as much distress, with potential yields below 50 bpa. Such shortfalls likely would trigger sharply higher prices to ration demand.
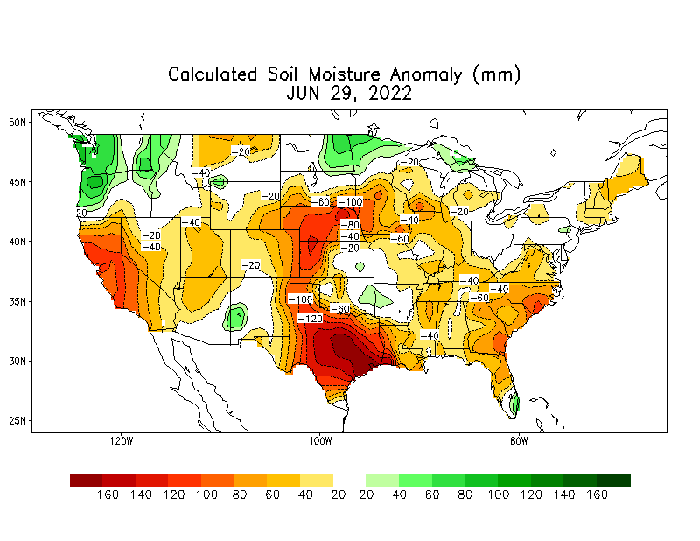
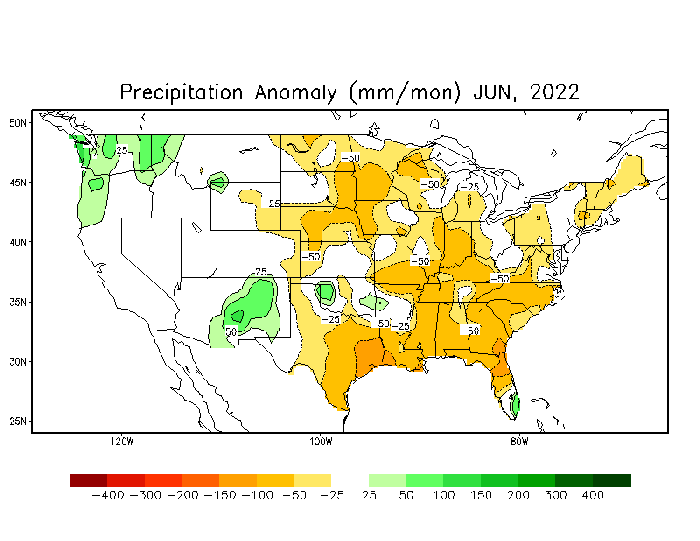
Causes for the stark contrast between crop ratings and VHI maps could stem from a bad algorithm in the computer model or noise from cloud cover. But the reason could be weather related, too. The stressed area – roughly a large part of the middle U.S. encircling the southeast Plains – matches soil moisture maps and areas receiving below average precipitation in June. Satellites may be picking up some stress that isn’t visible from the road.
Another potential cause for this divergence is hard to quantify, but one that many wonder about. Could lack of fertilizer applications due to high prices and supply chain bottlenecks mean fields are getting fewer nutrients, along with less rain?
If true, hard evidence may not come for a while. Though USDA surveys growers in August, field samples won’t be pulled until September.
USDA updates old crop World Agricultural Supple And Demand Estimates July 12, which will incorporate June 30 acreage. But those changes could be relatively minor, keeping the clock ticking on a market looking for a bottom.
Knorr writes from Chicago, Ill. Email him at [email protected]
The opinions of the author are not necessarily those of Farm Futures or Farm Progress.
About the Author(s)
You May Also Like


