Supply and demand ultimately determine the price of corn and soybeans. But the scales of market economics are weighing these factors differently halfway through summer, helping account for the recent disconnect in prices between the two commodities.
To be sure, strong crop ratings reported for both crops – not to mention uncertainties caused by the coronavirus pandemic – continue to keep prices depressed. But while corn grinds towards contract lows, November soybeans have at least spent a little time above $9.
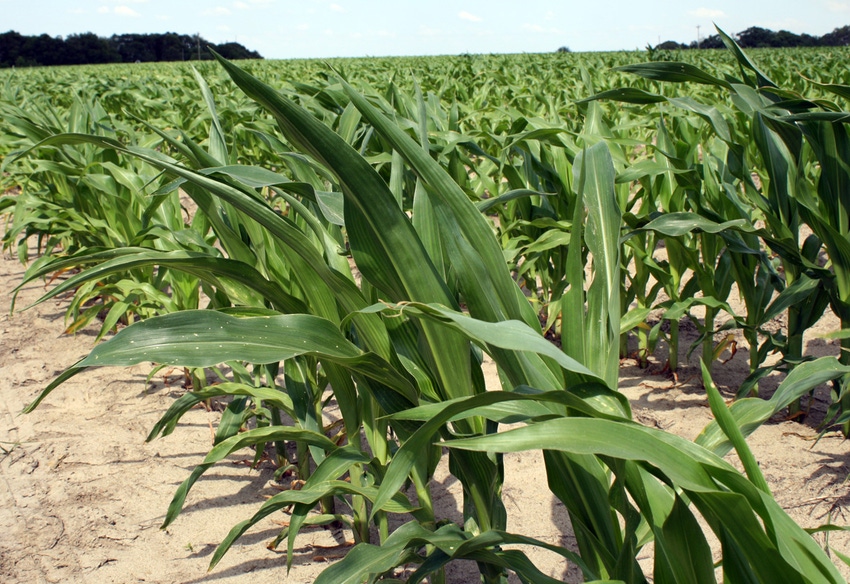
Corn’s woes stem from too much supply chasing too little demand in a market that thinks the 2020 crop is all but made despite a blistering start to July that saw temperatures average nearly three degrees hotter than average in key growing states. That heat helped deplete soil moisture that was good at the beginning of the month because rainfall was mixed. Iowa, Indiana, Ohio and Missouri saw below average precipitation while Illinois, Minnesota, Nebraska and South Dakota were wetter than normal.
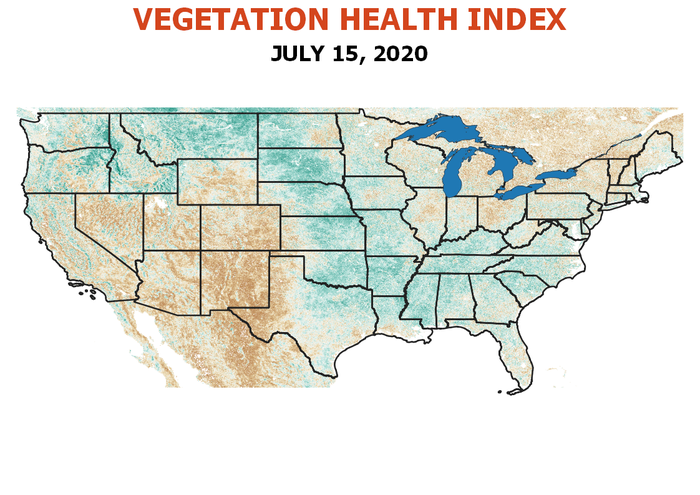
Forecasts remain warmer than average for the rest of the month with precipitation forecast to be normal to above normal for these states. If the forecasts holds, weather models suggest corn yields may come in around 173.4 bushels per acre, a little less than the “normal” statistical trend yield of 174.5 bpa, but well below the 178.5 USDA currently projects based on average growing season weather in a summer that’s been anything but. Vegetation Health Index readings are improving, but also point to yields that are below the market’s expectations.
Crop ratings are the odd man out in this analysis for corn. My yield model based on condition reports continues to hold above 180 bpa, though state-by-state evaluations declined by a half-bushel this week despite a steady reading from USDA nationally.
The difference between a 14.6 billion bushel crop and one that’s 700 million bushels larger is big, though not as big as might be expected given what’s expected to be abundant leftover 2019 supplies. But it likely would be more than enough to trigger rallies past $4 futures, focusing the market’s attention on demand.
Usage kept soybeans in the game longer this summer, despite negative old crop supply news. USDA raised its forecast of 2019 carryout earlier this month due to a large reduction in residual usage, correcting previous mistakes or suggesting the 2019 crop was larger than previously reported. But much of this bearish news was offset by encouraging demand.
China ramped up its purchases of U.S. soybeans despite renewed tensions over the South China Sea and Hong Kong. Year-to-date soybean inspections are down only 2.5% while USDA forecasts nearly a 6% drop of 98 million bushels. Official Census data is ahead of last year’s pace, though this metric is only has reported results through May.
Soybean crush is also going strong, and could beat USDA’s current estimate by 20 million bushels. Added together, exports and crush suggest Sept. 1 stocks could be 88 million bushels less than USDA forecasts for the start of the 2020 marketing year.
While soybean crop ratings are also above average, the market isn’t paying as much attention to these as it does with corn. Conventional wisdom says bean yields are made in August, but VHI analysis indicates projections soon can be made that are accurate historically. Unlike readings in corn, the current yield forecast for soybeans based on the VHI is right around the trend yield average of 50.3 bpa. So soybeans may not have the potential for yield surprises that corn does headed into USDA’s first survey of farmers and their fields in August.
Still, six more weeks of summer weather and a world full of uncertainty means the 2020 market isn’t over yet.

Knorr writes from Chicago, Ill. Email him at [email protected]
The opinions of the author are not necessarily those of Farm Futures or Farm Progress.
About the Author(s)
You May Also Like


