Experts in the game of chess break the game into three stages: the opening, the middle game and the end game. We can look at a crop in the same way, with planting season as the opening and harvest as the end game. Current crop conditions have me pondering the middle game, and a crop with potential to travel in two different directions.
Every Monday during the growing season, USDA releases a Crop Progress report. This report tracks planting and harvest progress and the overall condition of selected crops in major producing states. Crop conditions are noted by state as percent very poor, poor, fair, good, and excellent. There are different ways to view the data, but many analysts like to focus on the total percentage that is rated good or excellent. As of the second week in July, the 2021 U.S. corn crop is 65% good to excellent. This is below average but not by much, as better ratings in the eastern Corn Belt are providing some balance to some serious troubles in the northern half of the western Corn Belt.
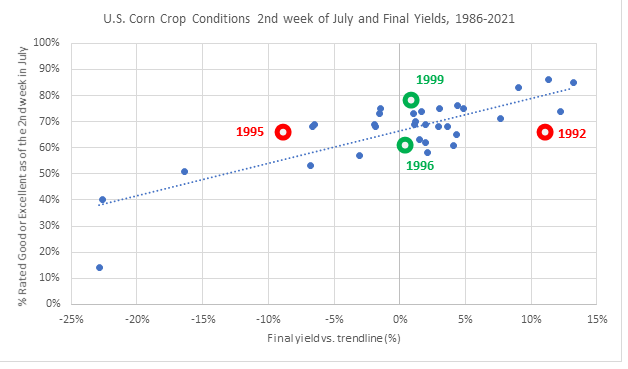
The accompanying chart shows corn crop conditions in the second week of July and final corn yields. A positive relationship between good-to-excellent ratings and final yields are visible but not particularly strong. Consider, for example, the contrast between 1995 and 1992. Both years were rated 66% good-to-excellent in the second week of July. The final yield in 1995 was nearly 10% below trend, while the final yield in 1992 was about 10% above trend.

(I calculate trend-line yields using simple 30-year regression, which tends to produce modestly conservative estimates of trend-line yield)
Consider another example. In 1996, the corn crop was rated 61% good-to-excellent in the second week of July. At a similar time three years later, the crop was in much better condition, rating 78% good-to-excellent. Both years delivered a final yield very close to trend.
July makes the corn crop, and that explains why crop conditions in the first half of July are not a good predicter of final yields. You might be wondering, “Why the focus on corn – what about soybean conditions and yield?” Because August makes the soybean crop. There can be no better example of this than 2003, when a dry August delivered the lowest soybean yields over a decade while corn yields set a national record.
There are private analysts who have developed elaborate yield projection models based on the data gathered in the weekly Crop Progress report. When the end game is on (aka harvest is weeks away), they can be surprisingly accurate. However, the second week of July is not the end game. This is the middle game.
About the Author(s)
You May Also Like


