
USDA lowered 2021 corn yields more than markets were expecting in today’s World Agricultural Supply and Demand Estimates report, with the latest tally coming in 1.1 bushels per acre lower than the lowest trade guess. That is going to tighten 2021/22 corn stocks to 8.5%, keeping supplies tight and futures prices profitable in the coming months. Corn prices shot 5% higher minutes after the report was released.
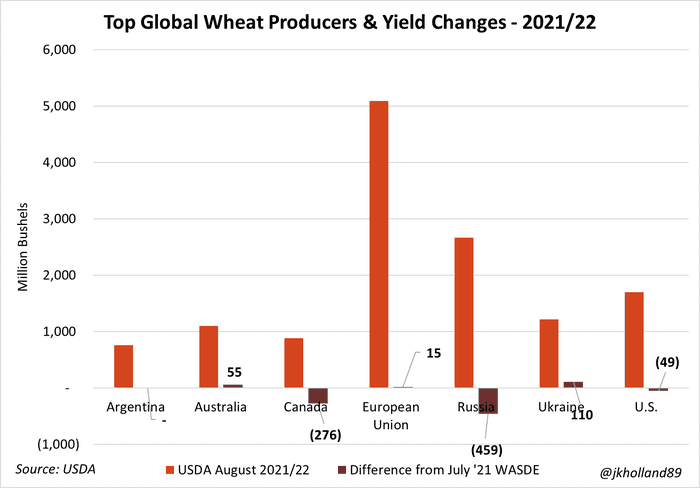
Soybean yields were trimmed 0.8 bpa, which was well within trade estimates. USDA made moderate cuts to U.S. white wheat, spring wheat and durum production estimates again. Production estimates were also slashed for fellow top exporters Russia (459M bu.), Canada (276M bu.) and the European Union (15M bu.), which will likely constrict global trade flows in the coming months.
Corn
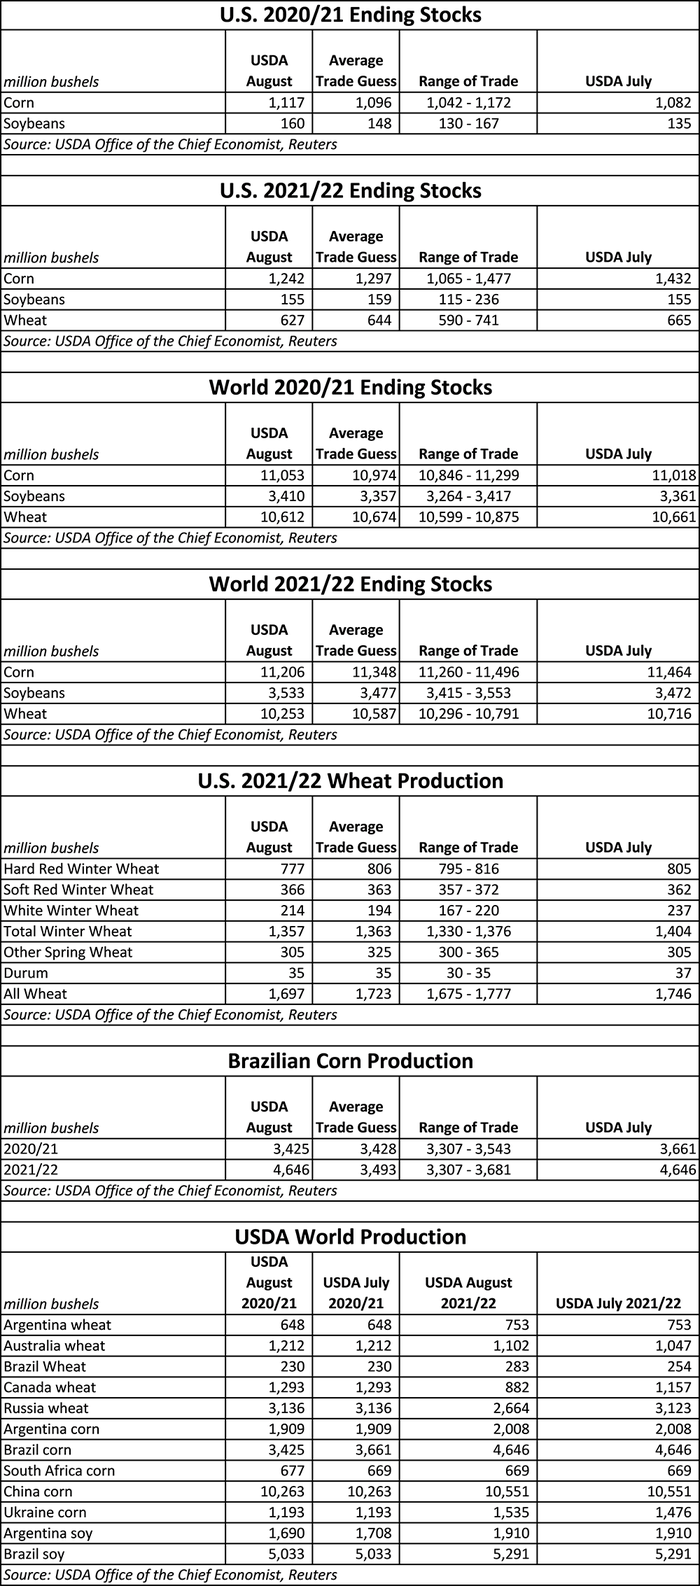
USDA’s new assessment of the 2021 corn crop is a bit more bearish than anticipated, citing a new average yield of 174.6 bushels per acre for a total production of 14.75 billion bushels. Analysts did forecast a modest decline from July’s tally of 15.165 billion bushels, but the average trade guess was higher than the agency’s official number, at 15.004 billion bushels.
“That yield will still tie 2016’s as the third largest on record,” notes Farm Futures grain market analyst Jacquie Holland. “USDA’s new 2021 corn production forecasts of 14.75 billion bushels will be the second largest U.S. corn crop in history, behind 2016’s record haul of 15.15 billion bushels.”
State-by-state production potential is varying widely this year, USDA notes. The agency forecasts record-breaking corn crops for Illinois, Indiana and Ohio in 2021, while noting that Minnesota and South Dakota are “below a year ago.” USDA also raised its season-average farm price another 15 cents to $5.75 per bushel.
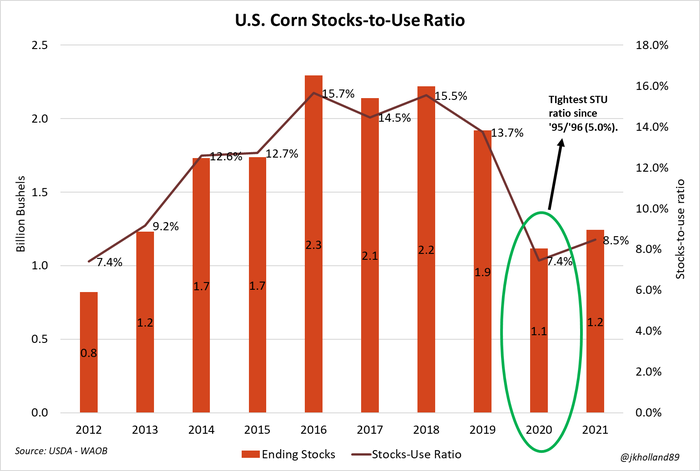
USDA is projecting 2021/22 U.S. corn ending stocks at 1.242 billion bushels, falling from the agency’s estimate of 1.432 billion bushels in July but again failing to match the average trade guess of 1.297 billion bushels.
“Despite raising 2020/21 ending stocks on slowing old crop corn export volumes and trimming 2021/22 feed and export volumes, USDA expects the smaller 2021 crop will tighten new crop ending stocks to 1.24 billion bushels,” Holland says. “At a stocks-to-use ratio of 8.5%, this year’s crop will land as the fifth tightest on record over the past 60 years. That bodes very bullish for new crop corn prices and should offer farmers some lucrative pricing opportunities at harvest this year.”
Corn 2021/22 world ending stocks also came in moderately below trade estimates, moving to 11.205 billion bushels.
“Major global coarse grain trade changes for 2021/22 include forecast corn export increases for Ukraine, Russia and India with reductions for Serbia and the EU,” today’s report noted. “Corn imports are raised for Bangladesh, Thailand and the United Kingdom but are reduced for Iran, Vietnam, Mexico, Egypt, Japan, Morocco, Saudi Arabia and Algeria.”
Soybean
USDA also projects lower soybean yield and production potential versus July. The agency trimmed average yield estimates from 50.8 bushels per acre a month ago down to 50.0 bpa in August – slightly lower than the average trade guess of 50.4 bpa. Production estimates were trimmed by 66 million bushels to 4.439 billion bushels, which was also below the average trade guess of 4.375 billion bushels.
“The new yield estimate is likely to be the fourth highest on record after a turbulent growing season kept the top end of yields away from producers,” Holland says.
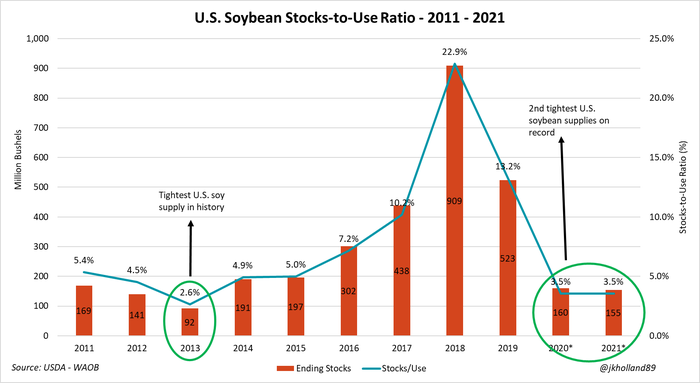
U.S. 2021/22 ending stocks for soybeans held steady versus July, at 155 million bushels. Analysts were expecting to see a modest increase to 159 million bushels – either figure shows historically tight domestic stocks this coming season.
“Even with smaller 2020/21 export and crush usage rates, USDA does not anticipate that the 2021 crop will satisfy growing domestic and international demand for U.S. soybeans,” Holland says. “The new ending stocks to use ratio for 2021/22 will likely remain very similar to that of 2020/21 at a meager 3.5%.”
The season-average farm price for soybeans also held steady from last month, at $13.90 per bushel.
World ending stocks for soybeans firmed from a month ago, meantime, to 3.533 billion bushels, thanks in large part to Brazilian crops that seem to rewrite the record books on an annual basis. USDA’s latest assessment for 2020/21 soybean production in Brazil is at 5.033 billion bushels, with 2021/22 production estimated at 5.291 billion bushels. Both assessments are unchanged from July.
Wheat
USDA’s outlook for wheat in the August report calls for “reduced supplies, lower domestic use, unchanged exports and decreased ending stocks.” Production estimates dropped 49 bushels from July, moving to 1.697 million bushels. The bulk of those reductions are due to lower yields for the hard red winter and soft white winter wheat crops. All-wheat yield averages fell 1.3 bushels per acre to 44.5 bpa.
Ending stocks for 2021/22 U.S. wheat fell 38 million bushels to 627 million bushels. That was lower than the average trade guess of 644 million bushels and means year-over-year stocks are now 26% lower. USDA raised the season-average farm price by a dime, now at $6.70 per bushel.
“Wheat is not usually a significant beneficiary of new USDA updates,” Holland points out. “In fact, wheat prices typically follow those of corn in the aftermath of WASDE reports. But in the past month, wheat has stepped out onto its own stage as global production shortfalls push prices higher.”
World 2021/22 wheat ending stocks fell more than 460 million bushels lower, to 10.253 billion bushels. Analysts once again overshot USDA’s official numbers, with an average trade guess of 10.587 billion bushels. The agency lowered its production estimates for some of the world’s top producers this past month, including Russia, the United States and Canada.
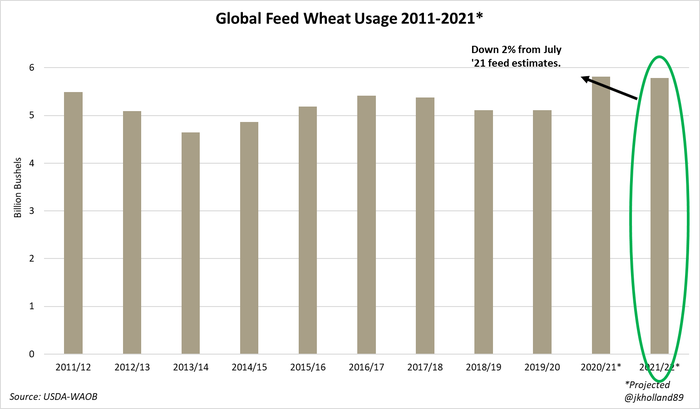
“For the first time in over a year, USDA cut global wheat consumption rates for livestock as soaring wheat prices make corn a more attractive and affordable option for livestock feeders’ rations around the globe,” Holland adds. “Old crop wheat feed estimates were trimmed 4 million bushels, while 2021/22 projections were slashed 117 million bushels as exportable supplies around the world begin to dry up.”
Click here for a look at USDA’s August WASDE report in its entirety.
Read more about:
YieldsAbout the Author(s)
You May Also Like


