The 2024 season is a long way off. USDA won’t publish new crop cotton balance sheet projections until the winter. Most outlook material won’t start circulating until the Beltwide Conference. Still, it is never too early to begin the planning process.
2024 production acreage
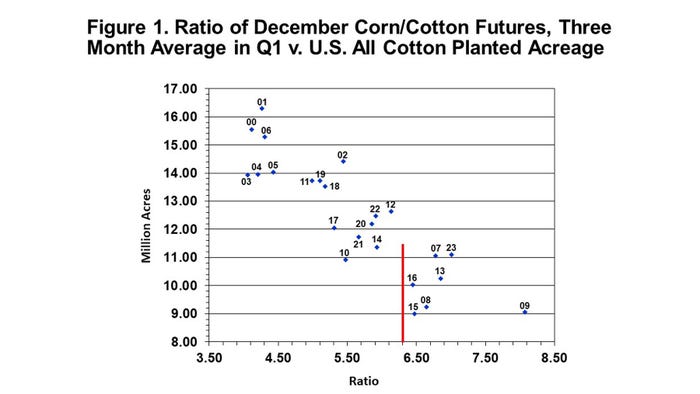
The first question to answer is the level of 2024 production with an emphasis on acreage. The price of competing crops, relative to cotton prices, is an important consideration to the level of planted acreage. The chart below shows a strong relationship between the level of U.S. upland and Pima cotton planted, as measured on June 30, and the ratio of December CBOT corn futures and ICE cotton futures during the first quarter of the year. The higher the ratio, the less cotton is planted.
Of course, there are other important competing crops as well: sorghum, soybeans, peanuts, and perhaps wheat. And there are other non-price influences, including how dry it was in Texas, the insurance base price, fixed cost influences, and the psychological influence of the preceding growing season. But the price ratio of corn to cotton appears to capture a lot of these other influences in explaining variations in cotton plantings.
What does the above chart imply for 2024? As of Oct. 2, with Dec’24 corn at $5.18/bu and Dec’24 cotton at 81.83 cents, the resulting ratio of 6.3 (see vertical red line in the chart below.) This ratio level is historically associated with roughly 11.5 million acres of cotton, assuming this ratio persists into Q1 of 2024. By then we will begin to have milestone acreage survey results from the ag media, the National Cotton Council, and USDA.

El Niño
The weather in 2024 will be a major consideration, as it always is. NOAA says the current El Niño condition is likely to strengthen, implying wetter-than-normal conditions in the fall and winter. That hopefully implies beneficial planting moisture prior to planting and relatively lower abandonment, as it did in 2007, 2010, and 2016.
For the time being, I will conservatively assume that the 2024 U.S. cotton crop has a 10-year average abandonment and yield, excluding the high/low extremes. Applying those assumptions to a planted acreage of 11 million pencils out to roughly a 16-million-bale crop. That could lead to under four million bales of ending stocks and similar price range outcome as we have seen during 2023/24, something between 75 and 85 cents. Considering the possibility of good moisture, above-average yields, and lower-than-average abandonment, I would guess that the risk is to the downside.
Cotton demand
The long-term demand question is perhaps the most uncertain part of this exercise. USDA has been assuming robust demand in the current 2023/24 marketing. I hope that is true and that it continues into 2024/25. But I am cautious about the possibility of macro headwinds related to world GDP, inflation, and central bank policy. Slipping into a recession is a possible risk that is historically associated with declining cotton demand. Short of that, just having low, slow growth in the world economy could deprive the cotton market of sustained price support, leaving only the volatile and short-lived weather market influence discussed above.
Export competitors
The last bearish wrinkle to the demand side is the increasing competition from our main export competitors, Brazil and Australia. Both countries produced strong crops in 2023, and Brazil may expand their cotton production in lieu of their second corn crop.
For additional thoughts on these and other cotton marketing topics, please visit my weekly on-line newsletter at http://agrilife.org/cottonmarketing/.
About the Author(s)
You May Also Like


