The beginning of spring is in the eye of the beholder.
Meteorologists use March 1 as the starting point, while astronomers cite the equinox, which occurred late on March 19 this year in the United States.
For grain markets, the season gets underway each year at the end of the month, when USDA releases Prospective Plantings and Grain Stocks, which come out March 28. This twin data dump, the biggest since January for the agency, sets the tone for both old and new crop corn and soybeans as farmers head to the fields. Either or both reports could move prices, though history warns producers to get ready for lower prices. And this year traders have only a few hours to react before taking a break for the long Easter weekend.
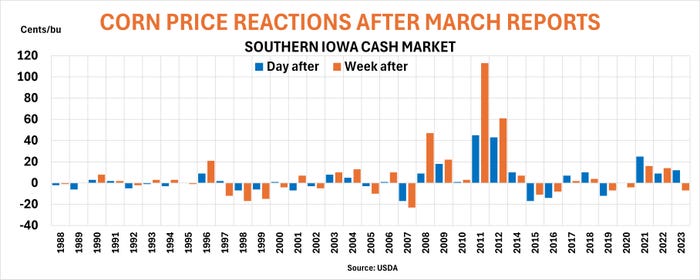
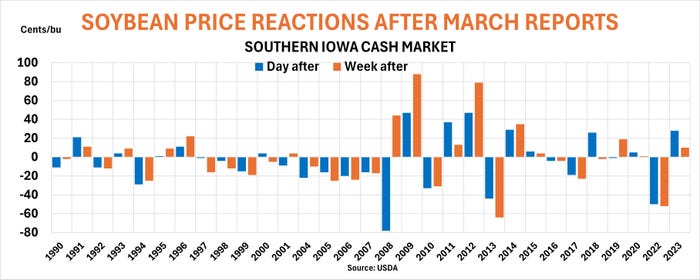
The two markets move in different directions, according to the government’s track record of Iowa cash grain prices over the past three decades. Corn gained 54% of the time the day after the releases, while soybeans dropped 42%. A week later corn was still higher in 54%, with an average gain of 19 cents in those years. Soybeans were still down 45% of the years, with losses averaging 20 cents. Still, the differences weren’t nearly big enough to be statistically significant, so take them with a grain of salt – or two.


Stocks math
Quarterly grain inventories are typically deep-in-the-weeds numbers that can be difficult for some traders to fathom, beyond headlines of whether they were higher or lower than analyst estimates. The change in stocks from quarter to quarter shows how much was used – “disappeared” in the parlance of economists. This year relatively large supplies could mute the impact of the reports, especially with weather in South America still making news.
Besides, much of the data that flows into stocks is relatively well known, based on previous reports from exporters and processors. The variable in corn usage comes from how much is fed to livestock, a number that USDA doesn’t calculate directly but infers from the amount of disappearance not attributed to processors.
Crush and exports soak up most of soybean demand with a little going for food and seed. The swing factor is a murky category called residual usage, which USDA uses to make adjustments from previous reports. Some quarters this can even be negative, making stocks even more tricky for analysts to estimate. A negative number this time could just be error, but it could also be a hint the 2023 crop was bigger than previously reported in January, though any changes won’t be officially confirmed until the September stocks report.
In any event, usage for the December-February quarter will almost certainly mean more soybeans were on hand March 1 than in 2023, with the total around 1.8 billion or more.
Corn stocks could come in around 8.4 billion bushels, the most since the 2018-2019 marketing year. The feed total for corn includes its own residual component, and USDA also started updating its production estimates for that crop eventuality some years.

Acreage questions
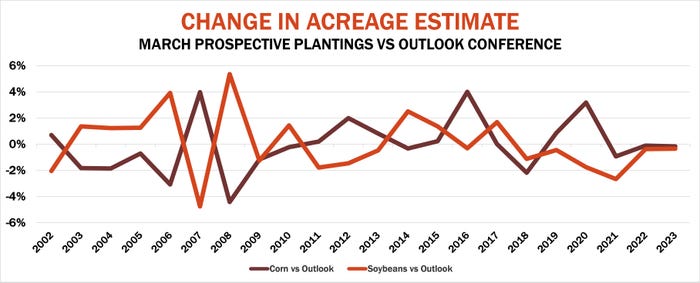
But most of the interest in this year’s end-of-March reports comes from results of USDA’s first survey of farmers about their spring planting plans. Previous estimates put out in November and updated in February at the agency’s outlook conference were strictly based on economic models, not actual input from farmers. These pegged corn acreage at 91 million, down from 94.6 million in 2024, with soybeans rising to 87.5 million from 83.6 million a year ago. The latest Farm Futures survey, released Friday, has corn at 92.4 million, with soybeans at 86 million – enough to produce big crops if yields are normal.
Differences between the February and March estimates are even tighter than the stocks changes. Over the past 22 years the March corn number was lower 45% of the time – also not enough to be anywhere close to statistically significant. For soybeans the split was a dead-even 50-50.
In other words, a jump ball that’s perfect for the market’s version of March madness.
About the Author(s)
You May Also Like


