The scene was set for drama when USDA released Sept. 10 supply and demand estimates. But despite plenty of adjustments in the data and wild swings in prices, the latest update from the government failed to provide enough news for markets to founder this fall.
Uncertainty surrounded the report. Not only did USDA’s National Agricultural Statistic Service update its acreage estimates, instead of waiting until October as usual. But the separate Farm Service Agency accidentally released enrollment totals two days early, rather than wait until after the supply and demand numbers came out.
As expected, USDA increased its estimate of corn and soybean yields, but split the difference on acreage, adding around 600,000 to corn while trimming beans by 300,000. These and other changes to old and new crop demand weren’t enough to produce a big enough surprise to change the narrative about prices much.
For the record, 2020 crop corn ending stocks rose 70 million bushels to 1.187 billion due to lower exports and usage to make ethanol. New crop production increased 246 million bushels to 15 billion on yields of 176.3 bushels per acre and harvested acreage of 85.1 million, with larger supplies encouraging more exports and feed usage than previously expected. The increased demand would partly offset larger supplies, with 2021 crop ending stocks up 166 million to 1.408 billion. The forecast for average 2021 crop cash prices dropped 30 cents to a still respectable $5.45.
Soybean numbers followed a similar trajectory overall. Old crop ending stocks as of Sept. 1 rose 15 million bushels to 175 million on weaker crush. New crop production edged 35 million higher to 4.374 billion on yields of 50.6 bpa. Increases for exports offset more weakness in crush, taking ending stocks up 30 million to 185 billion bushels. The estimate for average cash prices fell 80 cents to $12.90.
With updated quarterly stocks due Sept. 30 and more crop monthly reports on the horizon, USDA’s official numbers should see plenty of changes down the road. Demand concerns for corn and soybeans should focus on how much China buys, while production estimates for both crops could go up modestly. But until the market sees a real surprise – say, South American weather or pandemic news -- look for technical traders to drive short-term price swings. Growers looking for targets this fall can find plenty on charts to choose from.

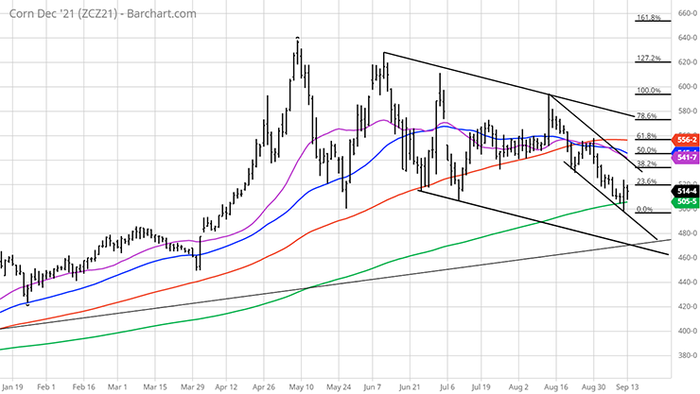
December corn held several key long-term support levels during Friday’s volatile session that saw a 26.5-cent trading range. Futures dipped below the 200-day moving average while taking out the May low, turning around at precisely the 50% retracement of the rally from last year’s contract low to the $6.38 high achieved in May.
If December can hold, it will avoid a test of a long-term support line drawn off lows from last summer and fall that otherwise could put a $4.775 low in play at harvest. To the upside, resistance lines from both short- and longer-term downtrends intersect other retracement levels that could attract selling around $5.30 and $5.70. Between those targets are moving averages from $5.42 to $5.62 currently.

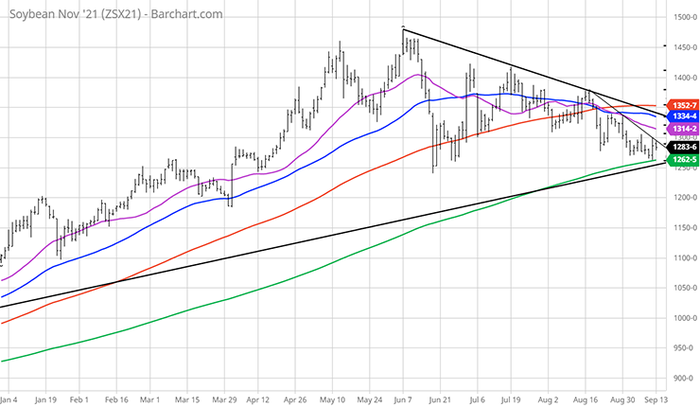
November soybeans also remain in short- and longer-term downtrends. After reversing higher off the 200-day moving average Friday, futures rallied up to the resistance line drawn off August highs, testing that target again Monday. The longer-term resistance line off June contract highs and the August rebound can be seen around the 50-day moving average at $13.345, with the long-term support line off 2020 lows in August and October around $12.57 currently for a line in the sand.
These chart price targets are relatively modest because they’re based on what the market knows now with both corn and soybeans in downtrends. A year ago December 2020 corn closed at $3.695 and November 2020 beans ended below $10. No one knew the bullishness to come. But nearby futures were at least in modest uptrends after holding long-term lows. Until supply and demand fundamentals change, bulls will need to prove a case for optimism that isn’t around yet this fall on the charts.
About the Author(s)
You May Also Like


