September 28, 2020

Reports indicate that 12.5% Russian (Class 3) wheat prices are 86 cents higher than at this same time last year. Russia sold wheat for October delivery for $225 per metric ton (mt) ($6.12/bu.) FOB (fee on board vessel) compared to $194 per mt ($5.26) this time last year.
At this writing, Oklahoma (Medford) and Texas (Perryton) wheat prices are $4.40 compared to $3.70 last year. Oklahoma and Texas wheat prices are about 70 cents higher than last year.
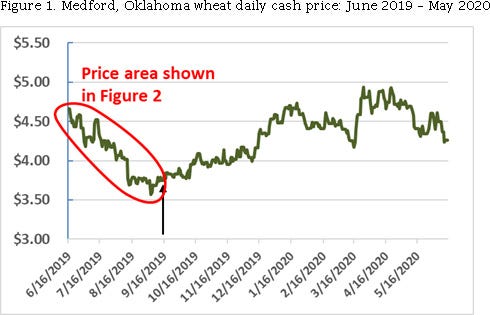
On June 16, 2019, the Medford Oklahoma cash wheat price was $4.66 (Figure 1). On Sept. 3, wheat prices bottomed out at $3.57. By Jan. 2, 2020, wheat prices had increased to $4.58.

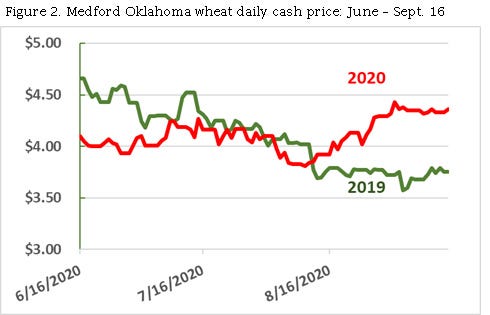
On June 16, 2020, the Medford wheat price was $4.10, 56 cents less than in 2019 (Figure 2). Between June 16 and July 8, 2020, prices stayed between $3.93 and $4.10. On July 15, prices peaked at $4.27. A downward trend was established that bottomed out at $3.81 on August 11, 2020. Between August 11 and Sept. 1, wheat prices increased from $3.84 to $4.43 and have remained within a 10-cent price range.

In 2019, wheat prices bottomed out at $3.57 on Sept.3. An upward trend was established that peaked at $4.73 on January 1. On March 25, the cash price was $4.94. Can wheat prices increase $1.37 during the 2020/21 wheat marketing year?
Since June 16, 2020, wheat prices have already increased 59 cents ($3.81 to $4.40). The current question is, “Will wheat prices increase another 78 cents between now and March 2021?”
In my opinion, there is a 50/50 chance of prices going up or down. Let’s look at the facts.
Negative factors: The world has excess grain. Record world wheat production of 28.3 billion bushels (Bb), compared to a five-year average of 27.6 Bb, is predicted. Record world corn production of 45.8 Bb, compared to a five-year average of 43 Bb, is predicted.
Russian wheat production is estimated to be 2.9 Bb compared to 2.7 Bb last year and a five-year average of 2.68 Bb. Black Sea wheat production is projected to be 4.3 Bb compared to 4.2 Bb last year. Australian wheat production is projected to be 1.05 Bb compared to 558 million bushels (Mb) last year. Total world hard wheat production (hard red winter, hard red spring, and Australian white wheat) is projected to be 8.6 Bb compared to 8.0 Bb last year.
See, COTTON SPIN: Higher cotton prices defy current fundamentals
World wheat ending stocks are projected to be a record 11.7 Bb compared to a five-year average of 10.1 Bb. The world wheat stocks-to-use ratio (ending stocks divided by use) is projected to be a record 42.5% compared to a five-year average of 33.3%.
Positive Factors: World wheat export demand has been relatively strong. China is projected to import 63% more wheat than last year and 190% more than in 2018/19. Egypt’s wheat imports are above average. Russia is projected to export a record amount of grain in September. United States wheat export sales are 8% higher than last year. Also, Black Sea wheat quality (protein) may not be as high as with the 2019/20 wheat crop.
Current Russian wheat prices are higher than last year. Current Oklahoma and Texas wheat prices are higher than last year. Given projected record world grain production, producers may want to take advantage of current prices.
About the Author(s)
You May Also Like


