June 1 is the official start to summer. After a 20% drop in corn prices over the past month, the livin’ is anything but easy for farmers girding to do battle with volatile grain markets in hopes of selling a profitable weather rally.
Price charts provide clues for marketers, though no signal works all the time, during the summer or anytime else. If you see these patterns develop, consider making at least an incremental sale. A series of small sales generally works best compared to swinging at the fences.
Watch the trend. Rallying markets create a pattern of higher highs and higher lows. The trend line drawn off these lows provides technical support for bulls. So when futures close below this line it may a tip-off that buyers are running out of interest.
Moving averages. Another way to watch for trends is by overlaying moving averages onto your charts. These lines are made from the previous closes over a period of sessions, say 25, 50, 100 or 200 days. Look for a line that’s held on the way up, then consider sales when it’s broken on the way down.
Open interest. Weather rallies go through several stages. Buying that drives markets higher can come from end users nervous about securing needed supplies, demand that normally causes an increase in open interest, that is, the number of contracts that are outstanding. But buying can also come from sellers closing out positions to avoid further losses, which can cause a drop in open interest. These short-covering rallies are suspect, so be on the lookout for other selling signals.
Reversals. Topping markets can burn out when there’s no one left to buy. When futures make new highs but close lower, watch out, especially if the “key reversal” occurs -- a day when the previous trading range is eclipsed and prices close lower. A reversal accompanied by an increase in volume and open interest could be a sign that new selling interest from bears is coming into the market.
Overbought conditions. Commodity markets are known for their roller coaster rallies. Momentum indicators like the relative strength index gauge whether buying or selling has hit extreme levels. In bull markets overbought conditions can continue going higher. But it’s a sign the air could be getting thin, especially if divergence is noted. That’s when futures make new highs but the momentum does not.
Gaps. Round-the-clock trading has cut the frequency of chart gaps – when futures open and stay higher or lower than the previous day’s range. But these chart patterns still occur, mostly after weekends and holidays when the market closes for several days – think July 4th, for example. Weather rallies can feature “breakout” gaps, followed by “measuring” gaps that can provide the basis for rally objectives. The final gaps can signal “exhaustion,” a warning the move may be nearing its end.
Here are December corn charts from three weather markets that show how these signals work.

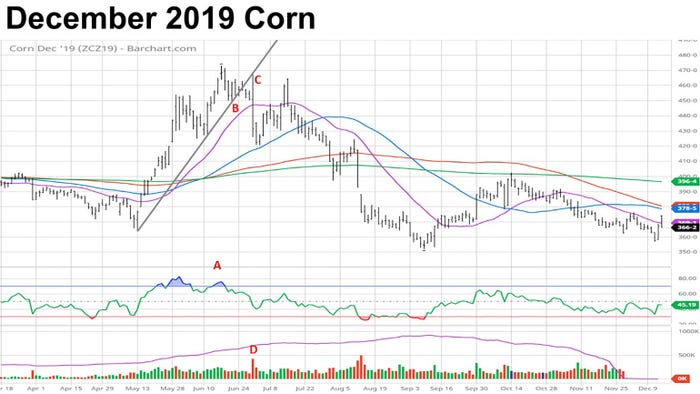
Searing heat – or at least the threat of it, is usually the trigger for weather rallies. But too much rain was the problem for 2019 crop corn, causing severe planting delays. Cool weather added to slow crop development producing a rally that peaked in June. When a little heat arrived in July it wasn’t enough to get back to the previous month’s highs.
Signs of a top formed early. When December corn made new highs in June, the relative strength index did not (A), creating divergence between the price chart and momentum indicator. A week later futures broke through the support line drawn off May and June lows (B), another bearish turn. The death knell came the following week, when futures rallied to test resistance at the old support line with a reversal known as an outside day down that violated the 25-day moving average (C). This move was made a surge in volume (D), with rising open interest that indicated new selling.

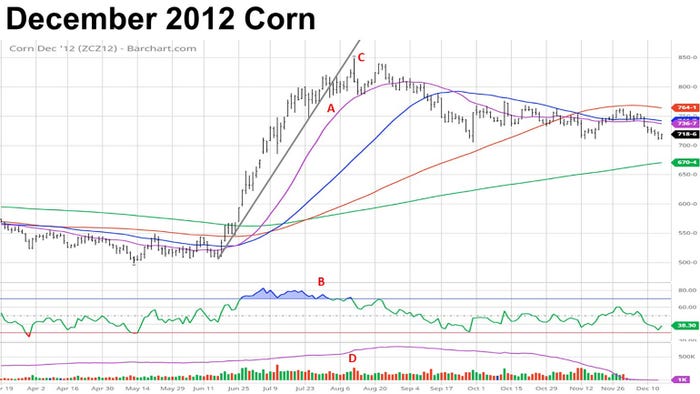
The historic 2012 drought produced the mother of all weather rallies, taking December corn to an all-time high that still stands. Selling when yields are so uncertain is especially difficult, but patience was rewarded for farmers using technical trading. The rally also showed the benefit of tuning into to multiple signals.
There were several bearish reversals in July, when divergence with the RSI was also noted. But the trend remained higher until the support line off June and July lows was taken out in early August (A), which was accompanied by more divergence (B). Finally, futures peaked on August 10 with a bearish reversal lower (C) that was done on an increase in volume and a big jump in open interest (D) signaling new selling, though the 25-day moving average wasn’t broken until the end of the month.

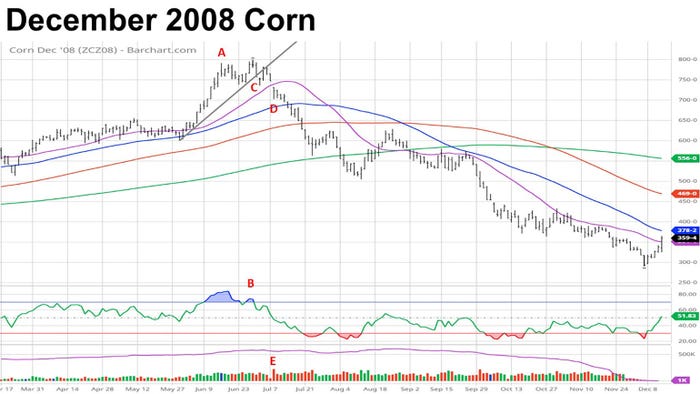
Wet conditions also hampered corn planting in 2008, when December futures flirted with $8 for the first time. The market reversed lower in mid-June (A), but held support until reversing lower again from a new high toward the end of the month, with RSI divergence noted as well (B), breaking the support line the next day after gapping lower (C). The final blow came when the market gapped lower again through the 25-day moving average (D), on a day with the highest volume during the life on the contract (E).
Knorr writes from Chicago, Ill. Email him at [email protected]
The opinions of the author are not necessarily those of Farm Futures or Farm Progress.
About the Author(s)
You May Also Like


