With recent rallies in May 2021 futures, the price for a nearby corn contract soared to the highest level since June 2013. A combination of fundamental factors has fueled the recent surge including strong ethanol margins, record U.S. corn exports and ongoing dry weather in key corn growing areas of Brazil.
Production of safrinha (double crop) corn accounts for about 75% of Brazil’s total corn crop. Harvest occurs in July/August and directly competes with U.S. corn in the world export market. For example, the Far East region (Japan, Taiwan, and South Korea) will import corn from both the U.S. and Brazil.
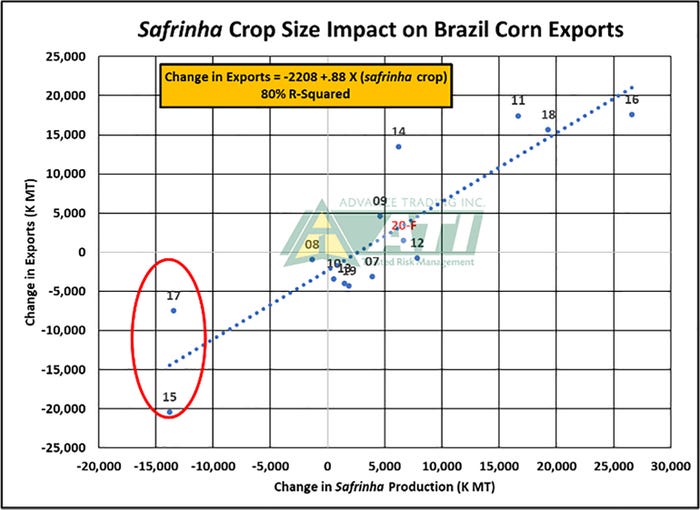
In years when Brazil experiences a shortfall in safrinha corn production, e.g., 2015 and 2017, the Far East will increase purchases of U.S. corn. Alternatively, a bumper safrinha corn harvest will displace U.S. corn, particularly during the first half of the following marketing year (Sep-Feb).

The graph plots the size of the safrinha crop (horizontal axis) and the response in corn exports (vertical axis). Year-to-year changes in corn exports are reasonably well correlated with changes in crop size. Note that in the two prior years with significant reduction in safrinha production (2015 and 2017), exports subsequently declined 20 MMT year-to-year in the first instance and 7.5 MMT in the second case. Should a reduction in crop size occur in 2021, it could support U.S. exports this summer as well as during Sep-Feb of the 2021/22 crop year.
Due to late planting, pollination of this year’s safrinha corn will extend into early June in southern Brazil, adding to market uncertainty. Price volatility (opportunity) in corn futures is historically high at this time.
Recent history shows final U.S. corn yield can be well above or below trend
Trend yield projection is a useful benchmark for production forecast, but the final production result can vary significantly. Planting of the 2021 U.S. corn crop has begun in earnest in some areas, although cold and wet conditions have slowed progress in other regions. If planting eventually is completed in a reasonably timely manner, the focus of the market will rapidly shift to yield prospects.
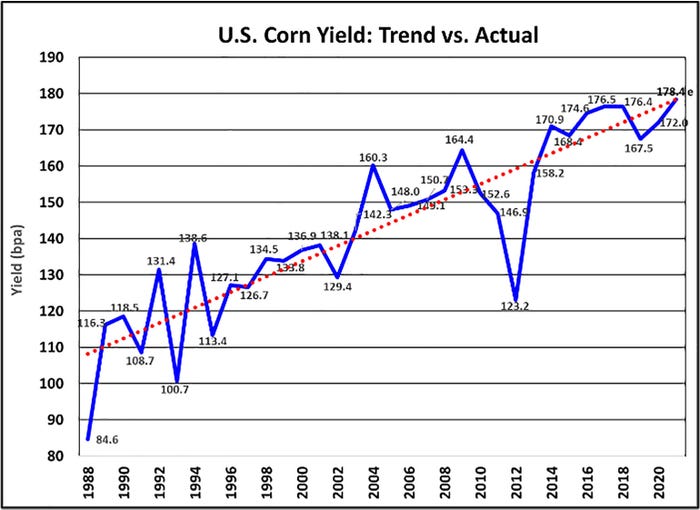
Temperature and precipitation data after planting is completed are frequently utilized to construct a national average corn yield forecast. Prior to the completion of planting, however, a common way to approach forecasting yields is to utilize a trend projection. A trend yield is based on a statistical analysis of actual yields from a previous time period. The trend yield is then utilized to develop a forecast for the upcoming year. Projections of the trend yield for U.S. corn in 2021 are varied. For example, USDA at its Agricultural Outlook Forum in February pegged the trend yield at 179.5 bushels per acre, while others are lower or higher. Let’s briefly review how recent actual corn yields have compared to trend projections.

The chart above examines actual yields (blue line) vs. trend (red line) for 1988 through 2020. It’s worth noting that there have been periods when the actual yield was very near the trend, e.g., from 2005 to 2008. More often than not, however, much greater variance has been observed. For example, in the bumper crop years of 2009 and 2014, the actual yield was well above trend. Alternatively, actual yield was below trend in 2011 and in the extreme case of the drought year of 2012, the yield was considerably under trend. Regardless of the trend yield utilized, this review confirms that post-planting weather developments can ultimately result in an actual yield that is substantially above or below that forecast.
The variability in yield relative to trend projections is a major factor contributing to the increased price volatility that is often seen throughout the growing season. Effective management of price volatility is essential to successful marketing. Working closely with your Advance Trading advisor to develop and execute a customized risk management strategy is strongly encouraged.
Contact Advance Trading at (800) 664-2321 or go to www.advance-trading.com.
Information provided may include opinions of the author and is subject to the following disclosures:
The risk of trading futures and options can be substantial. All information, publications, and material used and distributed by Advance Trading Inc. shall be construed as a solicitation. ATI does not maintain an independent research department as defined in CFTC Regulation 1.71. Information obtained from third-party sources is believed to be reliable, but its accuracy is not guaranteed by Advance Trading Inc. Past performance is not necessarily indicative of future results.
The opinions of the author are not necessarily those of Farm Futures or Farm Progress.
Read more about:
BrazilAbout the Author(s)
You May Also Like


