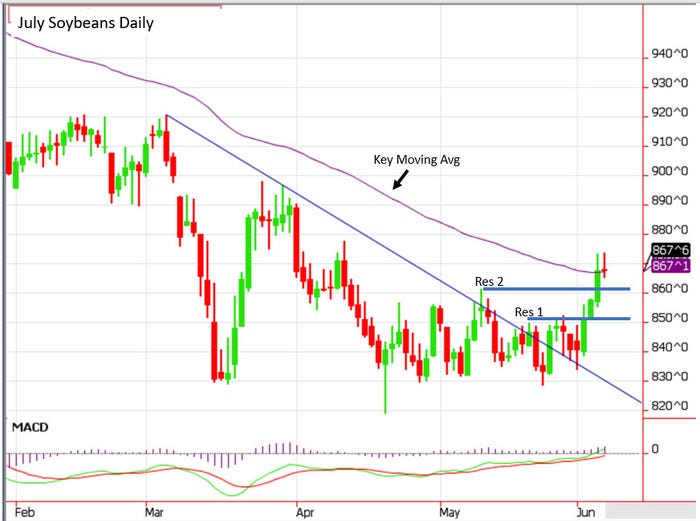
It was a good week for commodities as China purchases were reported, and the U.S. dollar fell as economic optimism grew stronger for a recovery.
As a result, corn and beans took out two key resistance points on the chart, closed above moving averages, and set a weekly reversal in place.
Most traders will now call the spring low “in.” Now farmers need to be diligent and make sure they sell the rally, but do it in a way that maximizes revenue. The key to how high the market goes will be determined by the success or failure of the U.S.-China trade agreement.
China is buying
Despite articles on Monday and another on Wednesday evening stating Mainland China told state buyers to halt U.S. ag purchases, or cancel 23 cargoes of U.S. beans, China showed up as a buyer. Year-to-date, the U.S. soybean export sales are 41.8 million metric tons, or about 1.536 billion bushels versus USDA’s projected exports of 1.675.
Of the beans sold, China has bought 6.762 mmt and ‘unknown’ 3.671 mmt. Assuming 80% of unknown is China, this equates to 9.699 million metric tons, or about 356 mil bu. of U.S. beans sold to China.
Currently, the U.S. is on pace to fall about 50 million bu. short of meeting USDA projections. But this is not like a normal year and China started out as a slow buyer; it could contra seasonally end up being an aggressive buyer into marketing year-end.
There is no available breakdown how the WASDE export demand estimate is distribute by country. So we are all guessing at what total U.S. exports to China should be. However, based on the numbers we have, we suspect that USDA would have to raise exports if China buys more than 442k tones per week the balance of this year. Just this week, USDA announced sales of 1.026 mmt beans old and new crop to China and unknown.
Change in market mentality
The reason this is so important is that we are providing you a barometer to follow which could quickly signal a change to the mentality of the market. Here's an example: If USDA increases export sales by a mere 50 million bushels, old stocks decline to 530 million bushels. Still a big number right? But this small adjustment causes new crop stocks to fall to 355 million bushels. New crop stocks are already forecasted to only be 9.4% stocks-to-use ratio. An adjustment like the example above would plunge that towards 8.3% --- a number associated with years that had summer highs between $10 and $12 per bu. soybeans.
Now, we are not forecasting a move towards $10-12 dollar beans at this time. However, if
We confirmed that China would exceed current purchasing targets,
We have any kind of bad weather or supply disruption,
the economy sparks an inflation run and
the dollar continues its downward path,
then we could safely say that the market would exceed all current projections for a top this coming summer. That's a lot of ifs. We cannot farm based on ifs. Thus we recommend farmers know what their marketing plan is and place orders to implement that plan.
One thing we would suggest at this time is to get some calls bought while volatility is very low and options are very cheap. For example, November $9.40 calls are $0.17. That seems like cheap insurance against sales made in a year when stocks-to-use ratios will be below 10%. With the ongoing geopolitical stress, a producer would put the farm in a high risk position if you did not sell this summer's seasonal rally. Selling would protect you from a calamity if trade deals failed. Yet if trade exceeded expectations and any of the “what ifs” we mentioned occur, these calls could neutralize the sales you make in an up market and allow you to resell your inventory at a much higher price.

AgMarket.Net uses tools to calculate your breakeven, find the best strategy that locks in your revenue per acre, and optimizes that strategy by determining the correct number of bushels you need to sell in order to achieve a strong risk management plan. If you have any questions, call me at [email protected], or directly at 815-404-1917
The risk of loss in trading futures and/or options is substantial and each investor and/or trader must consider whether this is a suitable investment. AgMarket.Net is the Farm Division of John Stewart and Associates (JSA) based out of St Joe, MO and all futures and options trades are cleared through ADMIS in Chicago IL. This material has been prepared by an agent of JSA or a third party and is, or is in the nature of, a solicitation. By accepting this communication, you agree that you are an experienced user of the futures markets, capable of making independent trading decisions, and agree that you are not, and will not, rely solely on this communication in making trading decisions. Past performance, whether actual or indicated by simulated historical tests of strategies, is not indicative of future results. Trading infromation and advice is based on information taken from 3rd party sources that are believed to be reliable. We do not guarantee that such information is accurate or complete and it should not be relied upon as such. Trading advice reflects our good faith judgment at a specific time and is subject to change without notice. There is no guarantee that the advice we give will result in profitable trades. The services provided by JSA may not be available in all jurisdictions. It is possible that the country in which you are a resident prohibits us from opening and maintaining an account for you.
The opinions of the author are not necessarily those of Farm Futures or Farm Progress.
About the Author(s)
You May Also Like


