May 21, 2020

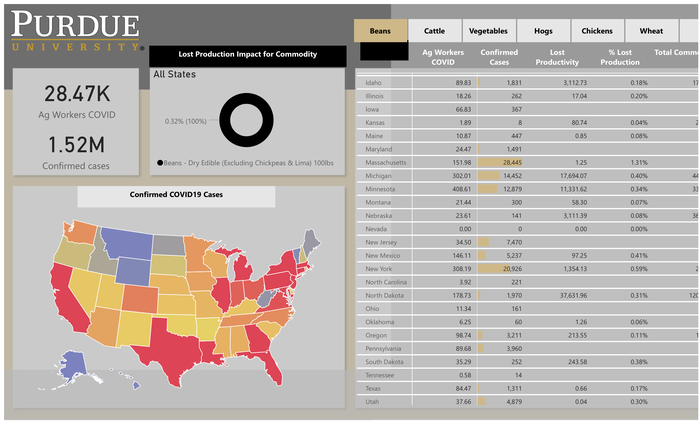
The Purdue Food and Agricultural Vulnerability Index online dashboard was created by the Department of Agricultural Economics at Purdue University, in collaboration with Microsoft, to quantify the potential risk to the supply of agricultural products as a result of COVID-19 farm and agricultural worker illnesses.
Vulnerability of the supply of an agricultural commodity depends on the number of farmers and agricultural workers affected, location of affected workers, crops and animals that are grown in the most impacted regions, and the degree to which production is concentrated in a particular geographic region.
The Purdue Food and Agricultural Vulnerability Index online dashboard, built on top of Microsoft Azure and Power BI platforms, estimates the share of agricultural production at risk by combining data on the number of COVID-19 cases in each U.S. county with the county’s total population, USDA data on the number of farmers and hired farm workers in each county, and data on agricultural production of each county.

“One of the things we’ve learned over the past few weeks is how important it is to know where our food comes from and to be able to identify and pinpoint potential problem spots. This tool was designed to help us detect if and when a problem emerges,” said Jayson L. Lusk, distinguished professor and department head of agricultural economics at Purdue and collaborator on the index.
“Digital tools can help alleviate some of stresses we are currently facing in the food sector," said Ranveer Chandra, chief scientist at Microsoft Azure Global and lead collaborator on the project.
Source: Purdue University, which is solely responsible for the information provided and is wholly owned by the source. Informa Business Media and all its subsidiaries are not responsible for any of the content contained in this information asset.
Read more about:
Covid 19You May Also Like


