It is frequently challenging to forecast crop production because of varying local weather and crop conditions. In the case of upland cotton, the situation is further complicated by plant biology. The major row crop substitutes to U.S. cotton include corn, sorghum, wheat, soybeans, and peanuts. The first three of these are annual grasses, while the latter are annual legumes. The reproductive strategy of these annuals is to produce as much seed (yield) as allowed by weather and soil conditions. As a result, aggregate yields of annual crops are often thought to be well correlated with weekly crop condition rates.
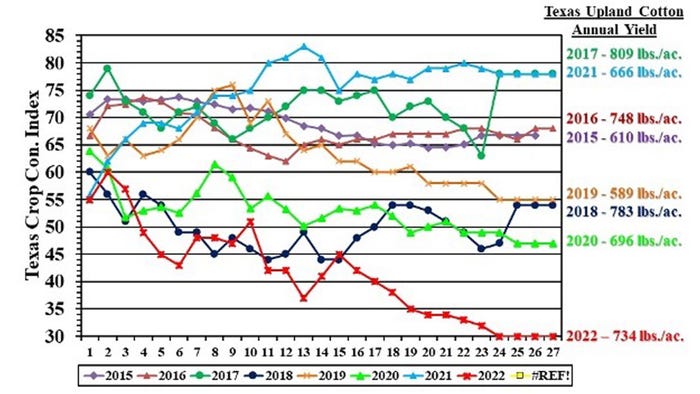
In contrast, upland cotton is relatively more complicated in its growth habits and resulting predictability. The reason is that cotton is a perennial in its native tropical environment, akin to a crepe myrtle bush. When grown as an annual crop in temperate regions, cotton plants can still shift back and forth between vegetative and reproductive growth. This mixed and indeterminate growth habit is illustrated by a poor visual inspection of the weekly cotton crop condition and the resulting Texas average cotton yield (Figure 1). The Texas aggregate situation is even further complicated by the range of planting dates, from March-April in southern Texas to May-June in northwestern Texas. Such phenomena in Texas can have a major influence on U.S. production estimates since Texas represents over half of U.S. planted acreage (USDA NASS).
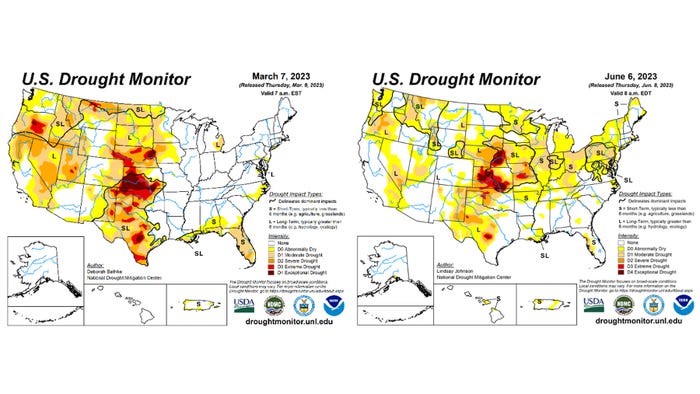
The situation in 2023 is further complicated by a mid-year shift in the weather. The first quarter of 2023 saw severe drought conditions over much of Texas (Figure 2, left panel). Widespread and repeated rains since April have reportedly helped developing crops in southern Texas while complicating planting in northwestern Texas. How much the latter will contribute to more or less cotton production is unknown. It is possible that the state will realize prevented planting from drought preceding prevented planting from too much rain. With much of the growing season still ahead, further shifts in weather may also occur. It may not be until early fall before we have reliable forecasts of the resulting production outcome.
Figure 1. Texas Cotton Crop Condition Index

Source USDA/NASS
Figure 2. U.S. Drought Monitor Maps from March 7, 2023, and June 6, 2023
 Source: Southern Ag Today, a collaboration of economists from 13 Southern universities.
About the Author(s)
You May Also Like


