COTTON SPIN: Midsummer report card — Grade: Incomplete
So, what can we say about the outcome for production and prices? Not much with certainty. From mid-July to mid-August, there is the potential for Texas production to swing a lot higher or a lot lower. If it is the latter, it could induce speculative hedge funds to go long again and give us one more shot at a futures rally above 70 cents.
July 14, 2017

The July World Agricultural Supply and Demand Estimate numbers for cotton reflected a minimalist approach by the USDA. In the absence of hard production data (from field sampling in August and September), they reduced projected U.S. cotton production by 200,000 bales in order to square up with the lower June 30 planted acreage measurement.
But that is all they did. In particular, they didn’t adjust abandonment, which would have been a chore, given the mixed effects of rain, dryness, and hail. There were widespread expectations that the USDA would raise forecasted new crop exports, but they also put that off.
I cannot throw stones at the USDA for delaying their adjusted projections of U.S. cotton production. Until August, there will be little in the way of comprehensive, statistically reliable data. What we’ll have until then is a Twitterverse of conflicting anecdotal pictures, reacting to local conditions, both good and bad. The bad likely includes heat and drought damage from planting up through the widespread rain events (with hail) of June and early July. The hail damage is described as serious, but it will take a while to know the impact on abandonment, production, and ultimately price.
This kind of prolonged uncertainty is not uncommon for this time of year. This seasonal uncertainty often brings an inordinate amount of focus on one other official indicator — the weekly compilation and summarizing of subjective crop condition ratings by the USDA’s National Agricultural Statistics Service. This process involves a weekly survey of regional representatives around the state who give a subjective rating of the crop from “Poor” to “Excellent”.
STATISTICAL CHALLENGE
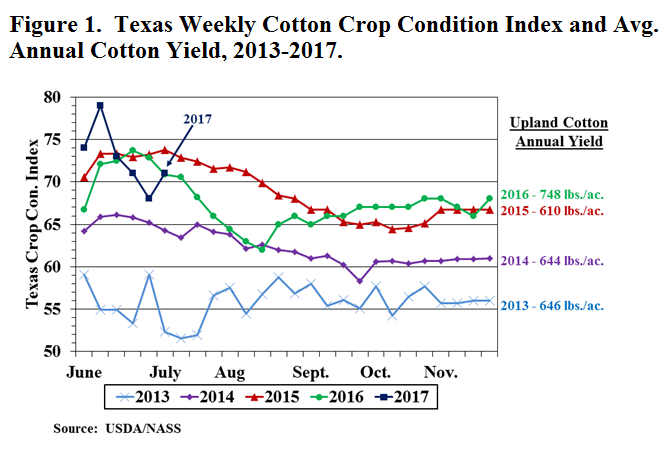
The challenge of this approach is that it is subjective, and it reflects cotton at different stages. For example, the latest weekly ratings in Texas include young cotton stands in the north and defoliated cotton in the south. The various rating categories are collapsed into one number called a “condition index,” which is depicted in Figure 1 for the last five years.
The 2017 chart shows relatively good weekly cotton condition indices, relative to other years. Does that suggest anything about the likely yield outcome in 2017? Well, not really. The crop indices simply do not predict the outcome very well for state average cotton yield.
One reason for this involves the on-again, off-again growth habit of the cotton plant. Another reason is the higher yield potential and stress resistance of newer cotton varieties. Yet another reason may be the fortunate incidence of long maturation seasons to make up for bumpy early seasons. Whatever the reason, this lack of correlation is evident from looking at the Texas average cotton yields in the years with high- or low-trending crop condition indices (Figure 1).
So, what can we say about the outcome for production and prices? Not much with certainty. From mid-July to mid-August, there is the potential for Texas production to swing a lot higher or a lot lower. If it is the latter, it could induce speculative hedge funds to go long again and give us one more shot at a futures rally above 70 cents. Even if that were to happen, the rally may not last that long, so I would view it as a selling opportunity.
For additional thoughts on these and other cotton marketing topics, please visit my weekly on-line newsletter at http://agrilife.org/cottonmarketing/

Figure 1. Texas Weekly cotton Index and Avg. Annual Cotton Yield, 2013-2017
About the Author(s)
You May Also Like


