

Subscribe to receive top agriculture news
Be informed daily with these free e-newsletters

Ag Marketing IQ: Here are the fundamentals to watch as you begin planning for a new growing season.

Soybean futures prices have come down from the lofty $17 price point, which occurred after the 2022 Russian invasion of Ukraine, to current prices now hovering near the $13 level. But there’s a case to be made that soybeans have a bright future.
In 2022, global demand for soybeans, soymeal, and soy oil was fantastic. Once the war began, the world became concerned that the supplies of soybeans and sunflower oil from the Black Sea region would be at peril, spurring soybean prices higher. Would there be enough global supply to meet demand?
In 2023, global demand for soybeans, soymeal and soy oil remains strong. However, even though various soybean growing regions of the world did not see full record soybean production in 2023 (Argentina and the United States), soybean prices have slid lower.
The reason soybean prices have eased lower from the 2022 price peak is because grain is being grown and exported throughout the Black Sea region even though the war continues. Also, in 2023, Brazil grew a record large soybean crop which was quickly exported across the world.
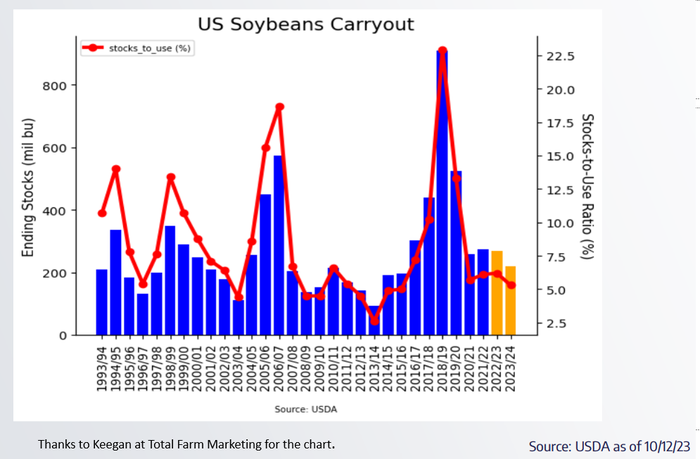
And while the global supply picture of soybeans remains sufficient for now, with global ending stocks slowly trending higher, the ending stocks picture in the United States tells a very different story of tight supplies.
On the supply side, the October 2023 USDA report suggested that for the 2023/24 crop year, there were 4.104 billion bushels of soybeans grown in this country. That was down from 4.27 billion bushels in 2022/23, and down from 4.465 billion bushels in 2021/22.
On the demand side, nearly half of the soybeans we grow are exported, and the other half are used for soybean crushing. (Specifically, 1.755 billion bushels are slated for export demand while 2.3 billion bushels are to be used for crush.)
The result is that ending stocks are pegged at a very low 220 million bushels, which is down from 268 million bushels in 2022/23 and down from 274 million bushels in 2021/22.
Also, it is important to see that the stocks to use ratio is at 5.25%. Meaning, we are quickly using up existing supplies.
Digging further into the demand story, the reality is that the United States has lost some soybean export demand to a very competitive Brazil. Just one year ago, the USDA pegged U.S. soybean export demand closer to 2 billion bushels versus 1.775 billion bushels today.
However, the soybean demand that continues to grow is thanks to the strong crush industry in the United States. According to the American Soybean Association in November 2022, "It is estimated that there are 60 soy crush plants currently operating in the United States. These 60 plants can use around 2.2 billion bushels per year…To date, there have been announcements for 23 plant expansions, which would add about 750 million bushels per year in crush capacity…Of the 23 crush plant announcements, 13 are for new plants and 10 are for expansion of current plants, at least two of which have been completed."
Take note, one year ago those 60 soybean crush facilities were using approximately 2.2 billion bushels of soybeans annually, and just in one year, thanks to stronger demand and additional facilities coming online, soybean use for crush demand has increased to 2.3 billion bushels as of the October 2023 WASDE report.
Looking ahead, the 23 plant expansions, which will add about 750 million bushels per year in crush capacity, are expected to be completed between now and 2025.
Now, here is some very simple math: to gain an additional 750 million bushels of soybean production, American farmers would have to plant an additional 14 million acres of soybeans, assuming 53.5 bushels per acre (bpa) nationwide yield. (According to the most recent USDA report, U.S. farmers planted 83.6 million acres of soybeans in the spring of 2023, with yield estimated at 49.6 bpa.)
This is a friendly demand story for soybeans!
Due to the overall strong demand for soybeans, the market may be sensitive to any perceived disruptions in global supply. We’ll scrutinize South American weather forecasts in the coming weeks and months.
If there are signs of less than perfect weather for either Brazil or Argentina, soybean futures price will likely respond with higher prices.
On the demand side, traders will be eagerly watching weekly export sales reports, not only looking at soybean export demand but also soybean meal and soybean oil. Monthly soybean crush reports will also be looked at with great detail to see how the crush numbers fare from month to month.
Looking at a continuous weekly chart of front month soybean futures, there are some technical indicators that may hint that a short-term low has been found for soybean futures. Now, these technical indicators do not necessarily mean that prices will shoot straight up, nor do they indicate how high prices could go, but they do suggest that perhaps a low is in place.
Looking at the chart below, you can see a bullish key reversal was posted in the first week of October for soybean futures prices.
This means that during the first week of October, soybean futures prices traded lower than the week prior, but prices traded higher and closed higher for the week.

Weekly soybean price chart
It is important to note that the price low during that first week of October also coincided with a historical, seasonal tendency for soybean futures to find a harvest low on October 1. As always, past performance is not indicative of future results, and that is important to note, especially as we enter the last few days of October.
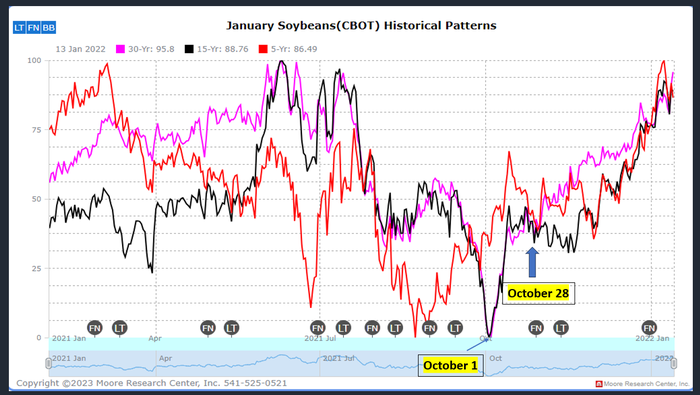
Take note that on the seasonal chart during the last days of October, there seems to be a mix of opinion and direction on where soybean futures prices are headed.
The 5-year and 30-year price patterns suggest higher prices ahead, while the 15-year pattern suggests sideways to lower prices for a few weeks.
Much of the actual price action that occurs in the weeks ahead will likely be tied to:
weather forecasts in Brazil,
harvest progress in the United States, and
export demand for soybeans, soybean meal and soybean oil.
In the weeks and months ahead, there will likely be plenty of price gyrations for soybean prices. There will likely be moments to capture various pricing opportunities and also manage risk. Get your marketing plans ready and be prepared for any price scenario to unfold.
Reach Naomi Blohm at 800-334-9779, on X (previously Twitter): @naomiblohm, and at [email protected].
Disclaimer: The data contained herein is believed to be drawn from reliable sources but cannot be guaranteed. Individuals acting on this information are responsible for their own actions. Commodity trading may not be suitable for all recipients of this report. Futures and options trading involve significant risk of loss and may not be suitable for everyone. Therefore, carefully consider whether such trading is suitable for you in light of your financial condition. Examples of seasonal price moves or extreme market conditions are not meant to imply that such moves or conditions are common occurrences or likely to occur. Futures prices have already factored in the seasonal aspects of supply and demand. No representation is being made that scenario planning, strategy or discipline will guarantee success or profits. Any decisions you may make to buy, sell or hold a futures or options position on such research are entirely your own and not in any way deemed to be endorsed by or attributed to Total Farm Marketing. Total Farm Marketing and TFM refer to Stewart-Peterson Group Inc., Stewart-Peterson Inc., and SP Risk Services LLC. Stewart-Peterson Group Inc. is registered with the Commodity Futures Trading Commission (CFTC) as an introducing broker and is a member of National Futures Association. SP Risk Services, LLC is an insurance agency and an equal opportunity provider. Stewart-Peterson Inc. is a publishing company. A customer may have relationships with all three companies. SP Risk Services LLC and Stewart-Peterson Inc. are wholly owned by Stewart-Peterson Group Inc. unless otherwise noted, services referenced are services of Stewart-Peterson Group Inc. Presented for solicitation.
You May Also Like
Current Conditions for
57°F
Mostly Cloudy
Day 54º
Night 46º
Enter a zip code to see the weather conditions for a different location.


