Some rather heavy rain and snow is currently moving across the Midwest, which is good to see, as a good portion of the belt was abnormally dry going into the spring planting season. However, this has put the brakes on the idea of an "early" planting season.
I encourage producers to use this delay to shore up their marketing plans for their old and unsold old crop stocks and new crops.
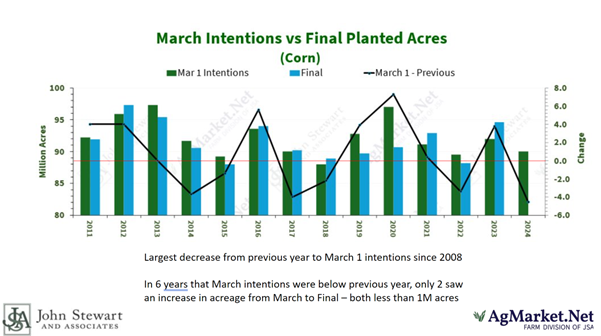
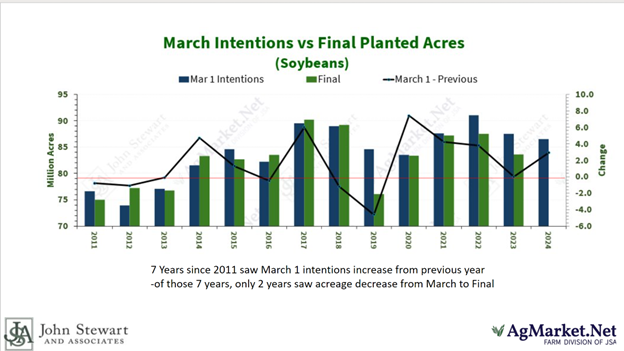
The Quarterly Grain Stocks and Prospective Plantings reports surprised the market, showing that producers plan to decrease corn acreage and increase soybean acreage compared to the previous year. The survey showed corn acres are projected at 90.036 million versus the average trade guess of 91.776 million (and well below last year's 94.641 million). The soybean planted acreage estimate came in at 86.5 million acres, up 3.5% or 2.9 million acres from last year.
The survey showed every state plans to plant more beans than last year except for Kansas. All Corn Belt states are anticipated to see notable decreases in corn acres from last year despite a fall and early spring weather conducive for fieldwork.
A 6.3 million-acre swing?
Corn and bean acres combined are projected at 176.5 million, which is 1.7 million below last year, and interestingly, total principal crop acres are down 6.3 million from last year. These acres could easily end up back in production.
History shows these numbers will see an adjustment, sometimes significantly, from this report to the final numbers. We anticipate corn acres and potentially soybeans will increase from the survey numbers when the final numbers are counted based on spring weather conditions.
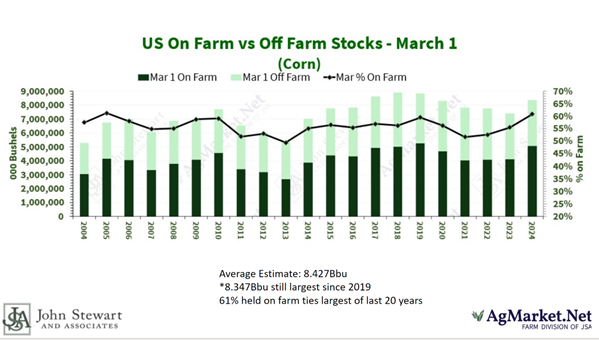
The March Quarterly Stock report highlighted some interesting trends in on-farm stocks. U.S. corn stocks were reported at 8.347 billion bushels, versus the average trade guess of 8.427 bbu and above last year's 7.396 bbu. Of the total, farm stocks total 5.079 bbu, the largest since 2019 and representing 61% of the total. This compares with 7.830 bbu on farms in December, which was 64% of the total.
Carry limits rallies in the cash market
Illinois holds the most significant stock position with 1.484 billion bushels, followed by Iowa at 1.417 bbu. All states saw a notable uptick in total corn stocks and the percentage of stocks held on farm versus last year.
The largest year-over-year increase in corn stocks was in Illinois, which was up 147.7 mbu from last year, followed by Nebraska, up 130.9 million bushels from last year. With the producer carrying such a large cash position, rallies in the cash market will be capped without a major production issue here or in South America, limiting price rallies.
Soybean stocks came in at 1.85 bbu, which is within the range of analyst estimates but larger than the average trade guess at 1.83 bbu. Total stocks are 9.4% over last year, with the largest year-over-year increases in Illinois, Iowa and Minnesota.
On-farm stocks are up 24.5% at 933 mbu, and off-farm stocks are down 2.7% at 912.07 mbu. On-farm stocks are larger than off-farm stocks for the first time since 2018. Like corn, these large on-farm stocks will tend to cap rallies.
Drought could spur rally
The current prices for both old and new crops (corn and soybeans) are not what producers want to see as they prepare to plant the upcoming crop. Yet, don't give up hope on a price rally that could develop at any moment.
Despite the moisture we are currently receiving, a good portion of the country is dealing with dryness and drought conditions that could worsen throughout the summer, potentially putting trend-line crop yields in doubt. The transition from El Niño to La Niña will have a big say. The faster the transition arrives, the more the odds of dryness and warmer than average temps increase.
With this in mind, the USDA working trend line yield of 181 bushels per acre seems like a stretch versus last year's record at 177.3 bpa.
As for corn, the safrina crop in Brazil has not even hit the critical pollinating phase. An early end to the rainy season could put this crop at risk as well.
Get ready to sell
Corn used in ethanol production suggests domestic demand is understated, which could lead to a bullish upward revision and a price rally. In February, Feb24, corn used for ethanol was 442 mbu, just above January 2024's usage. It was up nearly 11% from Feb23. In the first six months of the 2023-24 marketing year, corn usage for ethanol has reached 2.714 bbu, up 6.5% from one year ago, versus the USDA estimate of up 4%. This should lead to a 25- to 50-mbu increase in the USDA usage forecast in the April WASDE report.
No matter what might generate the rally, now is the time to determine price points you want to sell at and get the orders working, as the rally could be short lived.
If you have questions or would like specific recommendations for your operations, contact McCormick directly at 815-665-0461 or anyone on the AgMarket.Net team at 844-4AGMRKT.
The risk of loss in trading futures and/or options is substantial and each investor and/or trader must consider whether this is a suitable investment. AgMarket.Net is the Farm Division of John Stewart and Associates (JSA) based out of St Joe, MO and all futures and options trades are cleared through ADMIS in Chicago IL. This material has been prepared by an agent of JSA or a third party and is, or is in the nature of, a solicitation. By accepting this communication, you agree that you are an experienced user of the futures markets, capable of making independent trading decisions, and agree that you are not, and will not, rely solely on this communication in making trading decisions. Past performance, whether actual or indicated by simulated historical tests of strategies, is not indicative of future results. Trading information and advice is based on information taken from 3rd party sources that are believed to be reliable. We do not guarantee that such information is accurate or complete and it should not be relied upon as such. Trading advice reflects our good faith judgment at a specific time and is subject to change without notice. There is no guarantee that the advice we give will result in profitable trades. The services provided by JSA may not be available in all jurisdictions. It is possible that the country in which you are a resident prohibits us from opening and maintaining an account for you.
About the Author(s)
You May Also Like


