A lot of ink gets spilled on the Prospective Plantings portion of the USDA’s late March report series. Not to discount it – it is the first time we see actual farmer expectations of 2024 supply levels. However, there was another part to last Thursday’s report series that often gets overlooked.
USDA also published its Quarterly Grain Stocks report on Thursday, which provided the most recent look at corn, soybean and wheat stock levels. A bit of redneck math applied to these findings also shows the usage rates for these crops through the Dec. 1, 2023, to March 1, 2024, reporting periods (Q2 for corn and soybeans, Q3 for wheat).

This data was slightly more intriguing to me after the dust settled around the 2024 acreage findings because it helped to shed more light on usage rates and farmer selling paces that have dominated coffee shop and farm-level discussions through the winter season. It dispelled some myths, but it also created more questions about the future of old crop pricing for corn, soybeans and wheat.
Corn’s usage surprise
Since the beginning of 2024, we have all been trying to measure the rate of corn consumption in the market – largely because there is such a large stockpile of corn to consume before the 2024 crop is harvested.
Thursday’s report indicated there were 8.347 billion bushels of 2023 corn supplies on hand in the country as of March 1, a 13% increase from the same time a year ago but still lower than what the market had been expecting leading up to Thursday’s report series.
My redneck math shows that 3.824 bbu of corn (or 26.3% of anticipated 2023/24 consumption) had been used between Dec. 1, 2023, and March 1, 2024. And that is great news for corn growers who may have had panic attacks when corn dipped below $4 per bushel last month!
On a percentage basis, that is the largest Q2 corn consumption rate since rapid Chinese pandemic purchases took place during the same time during the 2020/21 marketing year. Through the first half of the 2023/24 marketing year, 57.6% of old crop corn supplies have been consumed.
For those keeping track (and I’m still working on a percentage basis here), that is the largest volume of corn usage for the first half of a marketing year since the same period in 2012-13.
That suggests that some of the reports about slow farmer sales might be overexaggerated. It also points to lower usage rates over the next six months. However, based on recent cash market activity, it doesn’t seem like end users are slowing down processing speeds anytime soon. Many end users are eager to take advantage of recent lows recorded in the corn market.
So those of you with some corn still in the bins could see some pricing opportunities in the months ahead. Processors in the Heartland continue to post cash bids at a premium to May 2024 futures prices. Ethanol plants are largely offering cash bids that are flat with futures prices, though it varies by region. Increasing river shipments to export terminals have resulted in slightly higher cash offerings, though those bids continue to be offered at a discount to nearby futures prices.
It will be up to you to take advantage of those profit openings when they arise, and I guarantee the opportunities won’t last long, particularly if we see early planting speeds for corn that could increase 2024 acreage expectations. And South American production remains a critical factor for corn prices around the globe.
Brazil is currently enjoying regional rains, which benefits newly planted safrinha corn crops. Over the next 10 days, that forecast could dampen U.S. corn export prospects. But dry weather is expected to intensify in Brazil after that period, which could limit safrinha yield development. If we start to see issues with drought in Brazil’s safrinha fields, then those export market cash bids in the U.S. corn market could turn higher.
Soybeans still have price potential
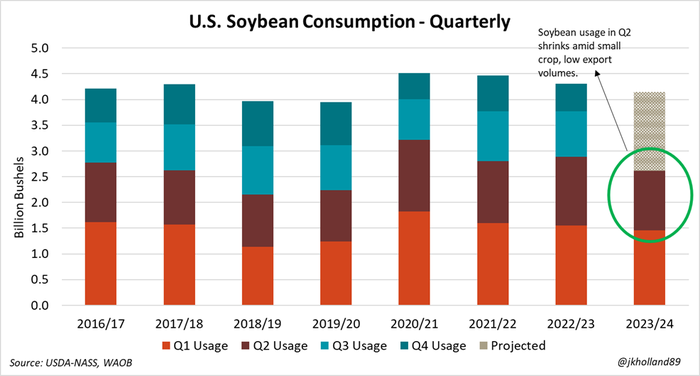
Q2 usage rates for soybeans came in slightly lower than markets had been expecting last Thursday, though perhaps that was not a total surprise. Smaller crops harvested by U.S. soybean producers last year have certainly limited opportunities for buyers. Rising export volumes following Brazil’s massive harvest are also adding to that pain.

During the December 1 – March 1 reporting period, 1.156 billion bushels of soybeans were consumed. That resulted in the smallest Q2 soybean consumption volume since the same period in 2019-20 following that disastrous prevent plant year.
The soybean market is in a weird transition period. An extra 770,000 bushels of soybeans were discovered in off-farm storage readings through Dec. 1, 2023, indicating that last fall’s export volumes were likely smaller than originally thought. Growing domestic crush consumption for renewable diesel production has not yet reached full capacity by a volume that could offset falling export prospects, though domestic crush rates are undoubtedly growing.
February 2024 crush volumes published by USDA on Monday found the 12th largest monthly volume of soybeans were processed in February – the shortest month of the year – while each of the prior four reporting months reported top ten crushing volumes. This is important because February crush rates typically drop off noticeably from winter crush paces, but that didn’t happen this year.
In fact, February 2024 crush paces only dropped off their prior month counterpart by less than a million bushels. February 2024 crush volumes totaling 194.0 million bushels soared nearly 10% higher than the previous February high of 176.9 mbu recorded last year.
Through the first half of the 2023-24 marketing year, nearly three-quarters of anticipated soybean export volumes have been shipped, leaving only around 443 million bushels (give or take) left to ship out over the remaining 2023-24 marketing year. That accounts for just under a quarter of remaining soybean bushels on hand across the U.S. as of March 1, 2024.
That’s not a lot of soybeans to use up during that time, which suggests local soybean prices are going to be more dependent on domestic crush rates. At USDA’s current usage projections, another 1.131 bbu (or 61% of March 1 soybean supplies) will need to be consumed between March 1 and August 31 of this year.
Cash prices at soybean crush plants have strengthened this week, though many bids continue to be offered either flat or at a discount to May 2024 futures prices. Export bids also strengthened on Monday at river terminals, but those prices are being quoted at an even higher discount to May 2024 futures than at processing plants.
The uptick in cash prices at soybean crush facilities suggests that processors are gearing up for a strong spring and summer crush season. Crush rates tend to dip during this time of year, but if there are enough soybeans on hand locally and more crush plants coming online in the coming months, crush rates could remain strong for an unseasonably longer period.
Nearly 760,000 bushels of daily production is expected to come online in 2024. That’s a 10% annual increase in daily soy crush capacity from last year. If crush volumes buck seasonal trends this spring and summer, farmers could enjoy some atypical profit opportunities.
Wheat’s demand woes
While Q2 corn usage churned out better-than-expected results, Q3 wheat consumption followed a polar opposite story. Wheat’s Q3 usage rate of 333.6 mbu was the smallest Q3 consumption by volume as far as my data goes back, which is 1990.
Amid a strong dollar and rapid grain shipments out of the Black Sea, U.S. wheat continues to struggle to attract fresh international demand. The lower 2024 wheat acreage forecast should come as no surprise, especially if domestic demand is not keeping pace with historical wheat consumption patterns.
Food consumption of wheat in the U.S. through the second half of last year (the first half of the 2023-24 wheat marketing year) drifted 2% lower that the same time a year prior to 456.6 mbu. Food usage rates in the second half of wheat marketing years tend to drift lower than in the first half, which does not favor price prospects for wheat growers.
Plus, 2023-24 U.S. wheat export volumes are projected to fall to 710 mbu – the smallest U.S. wheat volume shipped to international customers since right before the Great Soviet Grain Robbery in 1971.
U.S. growers were limited in how much wheat they could produce last year due to a multi-year drought on the Plains, so consumption volumes for U.S. wheat were not expected to set any new records in 2023-24. But a shrinking U.S. cattle herd and declining U.S. human food consumption are not helping to support wheat prices in the U.S., while competition from Ukraine and Russia are limiting international sales.
With the recent U.S. wheat export slump, it seems as though a remarkable chapter in U.S. agricultural history is coming to a fork in the road. Since the late 1800s, the U.S. has dominated the global market as the top exporter of affordable wheat. But with shrinking acreage following depressed demand, that part of our collective agricultural history may be ready to write a different story.
About the Author(s)
You May Also Like


