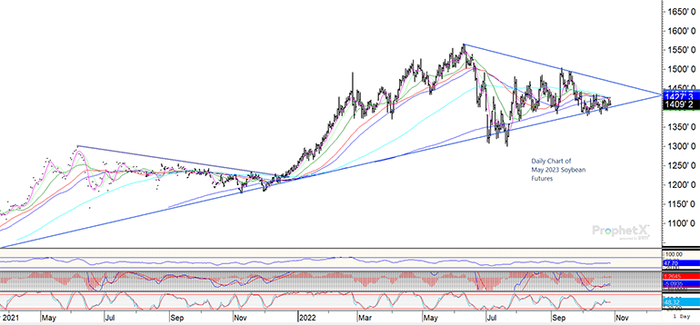
Upon close examination of soybean futures, prices have been in a 50 cent trading range for the past three weeks. Prices are well supported both fundamentally and technically for now. In fact, the long term up trending support line that soybean futures are sitting on right now, has held for two years.
For now, prices continue to hover on that long term support line, just waiting for fresh news.
But if you step back and look at the BIG picture, soybean prices have not only been consolidating for the past few weeks, they have also been consolidating since early summer.
Interesting to note is how last year, soybean futures consolidated essentially from early summer 2022 until December 2022 in a sideways fashion, or even a long skinny "pennant flag." And now the January 2023, March 2023, May 2023 and July 2023 soybean futures contracts are all trading in a similar pattern to last year.

Looks like more consolidation might be likely in the coming weeks, with all eyes on what fundamental news event will finally get this market to move out of this chart formation pattern.
The pennant flag measures the potential $2.50+ price move
Technically speaking, when looking at a pennant flag on a chart, it often times can tell traders, “Hey! Pay attention! There is a big market move coming down the road!” In order to understand how big the potential price move could be, traders measure where the start of the pennant began and find the high price (which for soybeans occurred on June 9, 2022) and the low price (which occurred on July 22, 2022) that defines the left side of the flag pennant. The difference between the two price points can often time give an approximate value of the next breakout move.
For example, the January 2023 futures have nearly a $2.90 range from the June high to July low. The March 2023 futures have a $2.73 range. The May 2023 contract has a $2.66 range while the July 2023 has a $2.62 range. The breakout point occurs where the support line of the uptrend intersects with the down trend resistance line. Looking at the chart and using the May 2023 contract that timeline looks to potentially occur in late November or early December, with the $14.25 area being the potential price destination and breakout point.
But make no doubt about it, the November 2022, the January 2023, March 2023, May 2023, and July 2023 soybean futures charts are all consolidating into a “pennant flag” formation. Right now, the pennant flag is still forming for soybean futures, and likely, the soybean futures price will continue to bounce back and forth in this trading range for a few more weeks, before finally making a move.
Fundamentals will dictate if price direction will be higher or lower
When we see these “pennant flags” on charts, all we know is that a potential price breakout likely coming, and can estimate how big the price move will be. We do not know, if the move is higher or lower, as the actual market fundamentals dictate that.
If the fundamentals justify a higher price point, add $2.50 (again it could be slightly more than a $2.50 price breakout based on the chart pattern, I’m using $2.50 for easier math projections…) to $14.25 (the breakout point for the May 2023 chart) and you’re looking at a higher price objective of the $16.75 price area. ($17.00 would be extreme overhead technical resistance on charts.) And also remember it can take MONTHS for those final price objectives to occur.
Now, what if there is a negative blacks swan of demand destruction? Or what if South America is able to produce a record crop? This market could easily move $2.50 lower also. A $2.50 price move lower from $14.25 points to $11.75. Are you ready for that?
Fundamental news to monitor
Soybean futures have plenty of headlines to keep traders on their toes for clues about this potential price breakout. There is an important presidential election in Brazil this weekend, the Fed meets next week to likely raise interest rates, U.S. elections in early November, there is a USDA report coming up on November 9, the railroad strike, and of course keeping an eye on the grain corridor in Ukraine and ultimately weather in South America.
Get your marketing strategy ready. A $2.50 price swing in soybeans, either higher or lower, is significant. Be ready for anything.
Reach Naomi Blohm at 800-334-9779, on Twitter: @naomiblohm, and at [email protected].
Disclaimer: The data contained herein is believed to be drawn from reliable sources but cannot be guaranteed. Individuals acting on this information are responsible for their own actions. Commodity trading may not be suitable for all recipients of this report. Futures and options trading involve significant risk of loss and may not be suitable for everyone. Therefore, carefully consider whether such trading is suitable for you in light of your financial condition. Examples of seasonal price moves or extreme market conditions are not meant to imply that such moves or conditions are common occurrences or likely to occur. Futures prices have already factored in the seasonal aspects of supply and demand. No representation is being made that scenario planning, strategy or discipline will guarantee success or profits. Any decisions you may make to buy, sell or hold a futures or options position on such research are entirely your own and not in any way deemed to be endorsed by or attributed to Total Farm Marketing. Total Farm Marketing and TFM refer to Stewart-Peterson Group Inc., Stewart-Peterson Inc., and SP Risk Services LLC. Stewart-Peterson Group Inc. is registered with the Commodity Futures Trading Commission (CFTC) as an introducing broker and is a member of National Futures Association. SP Risk Services, LLC is an insurance agency and an equal opportunity provider. Stewart-Peterson Inc. is a publishing company. A customer may have relationships with all three companies. SP Risk Services LLC and Stewart-Peterson Inc. are wholly owned by Stewart-Peterson Group Inc. unless otherwise noted, services referenced are services of Stewart-Peterson Group Inc. Presented for solicitation.
The opinions of the author are not necessarily those of Farm Futures or Farm Progress.
About the Author(s)
You May Also Like


