Fans of the ironic got some from USDA last week. The agency released its initial Crop Progress update for 2024 on April 1. With no corn, much less soybeans, planted in most states and many fields slammed by either heavy snow or a spring storm, some readers might have suspected an April Fool’s prank.
Make no mistake, these numbers are no joke to traders. They offer a sometimes hard-to-find national perspective about what’s happening on the ground. Moreover, planting progress is a key variable in popular models that analysts use to forecast corn yields long before combines start rolling.
Still, while timeliness is crucial, early planting is only one factor in the equation. Early birds do gain an advantage, but historically it’s not been big enough on its own to be statistically significant. And it’s statistically irrelevant for soybeans from a national perspective.
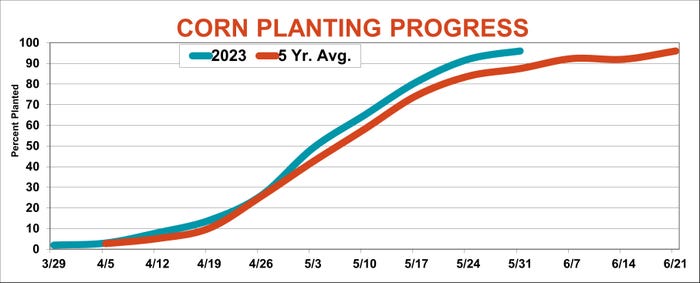
So, the key date watched in the market is how much corn is in the ground on May 15, especially in the eight states that produce most of the crop. Combined with severe June stress – if there is any – and July weather, this system isn’t perfect. But last year it provided a warning that production was larger than many anticipated, which ultimately sent prices into a tailspin after USDA confirmed the increase in its January annual estimates.

The more crop data the better
The multiple regression tool, developed by USDA economists, is just one way Crop Progress helps fix a bead on the moving target of production potential. Some favor using the percentage of fields rated good or excellent, others assign points for different condition categories – 5, for excellent, 4 for good, and so forth. I also tweak these by using ratings for the 18 states covered for corn, weighted by the latest current acreage reported by USDA, rather than totals reported the year before. Crop Progress also covers more states: 18 for both corn and soybeans.
Some folks dismiss Crop Progress, believing the reports are filled out by those who may not have expertise or don’t get around the county they’re supposed to be observing – like bored secretaries. And the data is subjective, a “beauty contest” according to critics, though USDA does provide rankers with criteria for their classifications.
I also don’t rely only on weekly tables, which usually come out on Mondays during the growing season. Satellite tools such as the Vegetation Health Index are also useful, and more and more of these are available for those with plenty of computing power and knowledge of geographic information systems.
Finally, there’s nothing like the horse’s mouth – asking farmers themselves, which is what USDA does in its crop production surveys. Unfortunately, the first of these for corn and soybeans doesn’t hit until August, which is why Farm Futures started asking farmers for their views more than 30 years ago. To provide another early warning system, a few years ago we also started Feedback From The Field to get our own anecdotal reports from producers.
Which yield predictor is most accurate?
Looking at all these tabulations provides an array of answers, all of which more than meet the bar of statistical significance. That is, they’re not likely to extreme outliers or the result of mere chance. The trouble is that although one of them is usually spot on with USDA, the award for “best yield predictor” changes from year to year.
Last year, for example, Farm Futures January survey put corn yields at 176.1 bushels per acre, while state-adjusted Crop Progress ratings suggested a yield of 176 bpa at the end of the growing season before, and USDA printed 177.6 bpa.
Soybean ratings in October pointed to yields of 51.1 bpa, while the January Farm Futures survey was lower at 48.6 bpa, and USDA came in at 50.6 bpa. Results from vegetation maps and weather models were different, but they too reflected what was happening to the direction of yields: Corn yields rose, and soybeans fell, when those last monthly estimates came out in January.
And that’s probably the key to using these forecasting methods. I look at them all, downplay results that appear to be outliers and plug the most likely suspects into my other models for forecasting prices and selling ranges. This also takes into account the fact that vegetation indexes are less effective as the growing season winds down and Crop Progress condition reports end when most fields are harvested.
Condition reports won’t begin until May or June, depending on how fast crops emerge. Before that, corn planting progress is the metric to watch. While the market likes to talk about having 85% of the crop in by the middle of May, the average across 18 states is around 71%. Tossing out slow years raises that to 76%. Using only the eight states in the weather model raises those percentages to 73% and 79% respectively, but the 85% would be a fast year indeed.
About the Author(s)
You May Also Like


