The grain market version of Wall Street’s Santa Claus rally is far from a sure bet. But glad tidings for corn and soybeans could bring more good cheer for growers during January.
Investors differ on just what is or isn’t a holiday rally in stocks. Some believe it occurs in the week before Christmas; others track the day after Christmas into the first days of the New Year. Depending on your definition and time frame, chances for a rally in the S&P 500 Index run from 65% to nearly 75%.
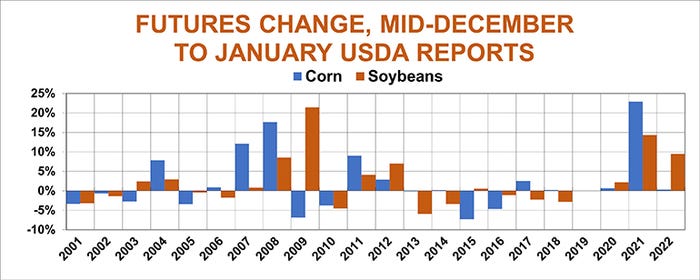
I use a different metric for the grain market. The starting point is mid-December, when July delivery futures on corn and soybeans tend to be weak in normal years. The first measuring point is USDA’s big January big crop reports, which include annual production, Dec. 1 grain stocks, and updated supply and demand forecasts, with winter wheat seedings also in play.

Small change
Grain market rallies during this four-week stretch don’t match the Santa Claus bump in the S&P. July corn ended higher 57% of the time while soybeans managed gains 52% of the years studied from 2001-2022. (Note that there were no USDA reports in 2019 due to the government shutdown.) The differences between gains and losses aren’t nearly large enough to be statistically significant – that is, more than mere chance.
Corn averaged a 10.3-cent gain, or 2.1%, earning 27.9 cents or 6.4% in up years, while losing 13.1 cents or 3.6% when the market was sour. Soybean gains averaged 24.1 cents overall, or 2.2%, making 71 cents (6.7%) in up years and losing an average of 27.6 cents or 2.7% in down years.
I also looked at trends after the reports.
Closing prices the day after the reports showed a slight tilt towards gains. July corn rallied 11 years the day after compared to the day before the data dump, with prices down 8 years and unchanged one year. Average gains were just under a penny. Soybeans posted gains 12 years against 9 with losses, with average gains coming in at 7.5 cents.

Did the gains last?
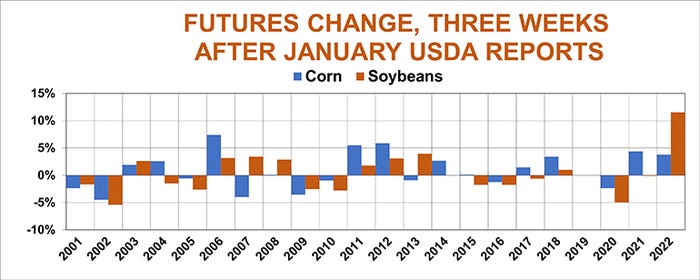
Three weeks after the reports, at the end of January, both corn and soybeans were still higher on average, with corn up 5 cents and soybeans gaining another 8.8 cents. But while corn was higher 12 of the 21 years, soybeans were higher only nine times.
Still, while the paths taken by the two crops can diverge, they typically follow one another. So, if corn rallies after the reports, soybeans probably will too. Those correlations aren’t perfect by any means, but they account for more than half the variance in futures trends.
Moreover, gains into the report in one crop tend to be followed by rallies in both crops afterward, suggesting corn growers should hope for a rally in soybeans into the January reports, and vice versa.
Of course, these connections aren’t perfect. The biggest outlier came in 2009. Soybeans rallied sharply into the reports while corn fell. But three weeks later both crops were lower than the day after the report.


Bearish corn trend
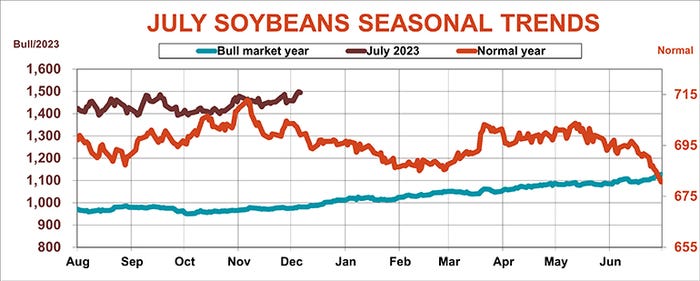
Seasonal charts also support paying attention to price moves headed into and out of the reports. In crop years with normal price trends, soybean futures can’t take out fall highs, and slide into March, with spring recovery failing to match the fall peak. But in bullish years, July futures in December on average take out fall highs – and keep on going into delivery. July 2023 beans notched that milestone last week as it traded above briefly above $15.
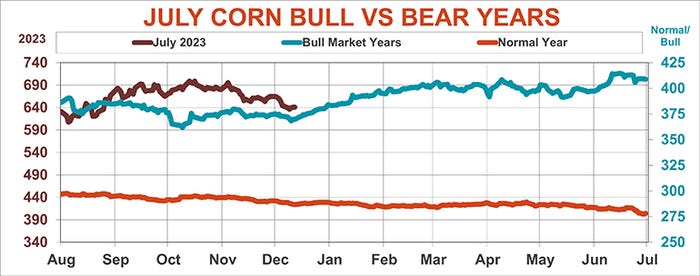
That pattern also shows up on the seasonal corn chart, but the July 2023 trend is looking more bearish. July 2023 corn broke below fall lows in the first week of December, unlike in bullish years, when the bottoms held. Reversing that pattern this time around would take a move to above fall highs around $6.99 in January.
What could cement a move higher – or push the market lower? In addition to supply and demand fundamentals, black swan events could also make or break the market’s year.
Black swans are unpredictable, by definition, and recent years offer plenty of examples, from the Covid pandemic to Russia’s invasion of Ukraine. North Korea, China, Taiwan, Iran, or Washington events could all rearrange the market’s mood, for better, or worse, depending on your point of view.
South American drought
The supply side of the balance sheet comes into focus Jan. 12, when USDA publishes its final monthly forecast of U.S. corn and soybean production and Dec. 1 grain stocks. Surprises are almost a given, and could throw a monkey wrench into the best laid marketing plans. Farmer planting intentions out March 31 could give both bulls and bears another kick at the can, followed by spring weather for planting.
Demand focuses on both production around the world, which influences exports, and the needs of domestic end users for feed and fuel.
USDA knocked 75 million bushels off its forecast for corn exports Dec. 9 following a very slow start to the selling season, while making no changes to its soybean sales prediction. Those estimates could change as traders focus on impacts from an unusual third winter of La Nina cooling of the equatorial Pacific that spread drought concerns in much of Argentina and parts of Brazil, giving a lift to soybean futures lately.
U.S. weather forecasters last week continued to see the event weakening by spring, with only a 50-50 chance of it persisting through the first quarter of 2023.
USDA Dec. 9 made no changes to its forecasts for either corn or soybean production in the two countries, despite signs of damage.
Vegetation Health Index maps are a reliable indicator of yield potential, especially for soybeans as the calendar year winds down. The VHI for soybeans in Argentina las week was the lowest posted since the satellite measurement system began in 1982, with the latest reading only 40% of normal. Conditions in Brazil were a little better, but still lagged the long-term average by 13%.
According to the Buenos Aires Grain Exchange, only 11% of the nation’s soybean crop was in good or excellent condition, compared to 78% a year ago, as fields were beginning to bloom. Corn ratings were also down, with 18% good or excellent, down from 85% last year. Pollination began as temperatures soared above 100% in some areas.
Domestic demand typically doesn’t have the potential to quickly turn around the mood because livestock feeders and biofuel plants don’t dramatically change their buying patterns quickly. Both corn and soybeans could be either helped or hurt by wild swings in energy prices that change demand for biodiesel and ethanol; otherwise, new EPA mandates don’t look likely to have much impact. USDA made no changes to its forecast for domestic usage of either crop in last week’s World Supply and Demand Estimates.
Knorr writes from Chicago, Ill. Email him at [email protected]
The opinions of the author are not necessarily those of Farm Futures or Farm Progress.
About the Author(s)
You May Also Like


