USDA reports continue to move markets. The last three government reports have been bullish corn while the last two of three have been bullish soybeans.
USDA lowered corn yield on both the September and October WASDE reports, and the quarterly stocks report at the end of September showed less old crop carry-in for corn than expected. USDA lowered soybean yield on both the September and October WASDE reports, while the reduction in October was necessary to offset the bearish quarterly stocks which showed more old crop carry-in than expected.
Crop size expectations have declined, yet so too have demand expectations. Corn and soybeans for export were both reduced in the October WASDE report and recent river issues have raised concerns regarding the ability to get soybeans out of the Gulf at the expected pace.
Price action
Now let’s consider price action. December corn tested $7 on the bullish September WASDE report, again on the bullish quarterly stocks report, and briefly above $7 just before the bullish October WASDE report. All three of those reports marked a short-term futures high, so keep that pattern in mind as we approach the November WASDE report.
Even though the corn ending stock estimate from USDA was tighter on the October WASDE than the September WASDE, corn futures settled lower on the day of the October report than it did on the September report and have yet to retest $7 since. Corn futures have been trading sideways for the last two months with three bullish reports in that period.
Soybean price action has been even less impressive. When USDA lowered soybean yield in September, which had them print a 200-million-bushel (mb) carryout estimate, the reaction was to take soybean futures to $15. A month later we get another 200 mb carryout estimate from USDA, yet futures are over a dollar lower and the best the market could do after that bullish report was $14.14 basis in the November futures.
So, what gives?
The question we should be asking ourselves is whether USDA has printed the lowest carryout expectations we will see. Is it possible that we will enter a period where yield estimates start to creep incrementally higher while demand estimates continue to move incrementally lower?
China concerns
Recent activity in China should be a concern to U.S. farmers. Ongoing restrictions from the current administration regarding chips and AI are seen by Chinese leadership as a form of economic warfare. During the “trade war,” China demonstrated its ability to focus on purchases from South America rather than the U.S. A looming potential record crop out of Brazil could give China the cushion they need to avoid buying U.S. soybeans. If that record crop comes to fruition, it is conceivable that Chinese demand for U.S. soybeans could take a substantial hit for the first quarter or two of 2023.
Meanwhile, Chinese corn imports for the month of September were down 56.6% year over year and 15% from a month earlier. Total Chinese Corn imports for the first nine months of the calendar year were down 25.9% from the same period a year ago. Chinese wheat imports in September were down 42.2% year over year and 30% from the previous month.
None of this paints a friendly picture for export demand across the board. Here’s what to watch for on the chart to know if the market is growing more concerned:
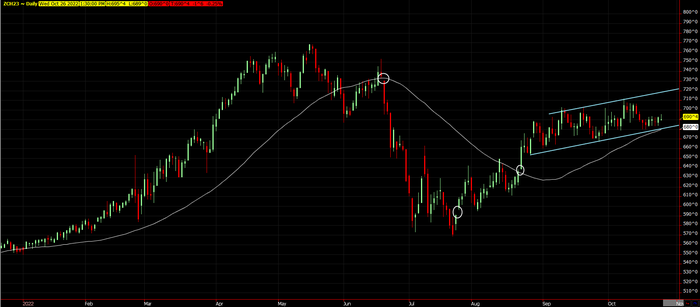
March corn has been in an upward trending channel since late August. A break below $6.80 will violate the lower end of the channel as well as the 50-day moving average (dma). The 50 dma helped confirm the low made in July. A move to the upper end of the channel, especially if timed with the November report, should be seen as a selling opportunity. March corn has three gaps, one above and two below. They are $7.3275, $6.38, and $5.91.

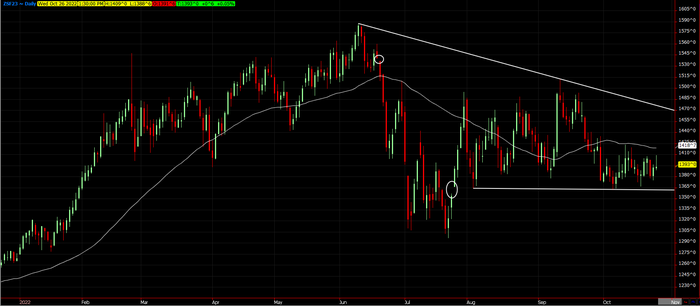
January soybeans have held a base of support at $13.60. A breach of that support will signify a breakout to the downside with the first objective being a test of the July low, while big picture measurements suggest a move to retest $12.00-12.50. A break above the $14.2325 high made on the October WASDE report is necessary to suggest a retest of the upper end near $15 is possible. January soybeans have two gaps on the chart, one above and one below. They are $15.40 and $13.57.

There are several ways to provide protection on unpriced bushels while allowing opportunity to capitalize on a move higher. If you think the market will continue to move sideways, well there’s a strategy to capitalize on that too. Feel free to contact me directly at 815-665-0463 or anyone on the AgMarket.Net team at 844-4AGMRKT. We are here to help.
The risk of loss in trading futures and/or options is substantial and each investor and/or trader must consider whether this is a suitable investment. AgMarket.Net is the Farm Division of John Stewart and Associates (JSA) based out of St Joe, MO and all futures and options trades are cleared through ADMIS in Chicago IL. This material has been prepared by an agent of JSA or a third party and is, or is in the nature of, a solicitation. By accepting this communication, you agree that you are an experienced user of the futures markets, capable of making independent trading decisions, and agree that you are not, and will not, rely solely on this communication in making trading decisions. Past performance, whether actual or indicated by simulated historical tests of strategies, is not indicative of future results. Trading information and advice is based on information taken from 3rd party sources that are believed to be reliable. We do not guarantee that such information is accurate or complete and it should not be relied upon as such. Trading advice reflects our good faith judgment at a specific time and is subject to change without notice. There is no guarantee that the advice we give will result in profitable trades. The services provided by JSA may not be available in all jurisdictions. It is possible that the country in which you are a resident prohibits us from opening and maintaining an account for you.
The opinions of the author are not necessarily those of Farm Futures or Farm Progress.
About the Author(s)
You May Also Like


