If farmers harvest record yields as expected this fall the bounty could come at a cost: lower prices. But good yields could also affect payments received under popular revenue-based farm programs, with soybean producers most at risk according to a new Farm Futures study.
Our first forecast of county yields for 2016 suggests nearly half of soybean counties could get nothing under the Agriculture Risk Coverage farm program most growers selected. By contrast, more corn counties than ever could be eligible for a check.

http://ffcharts.com/SoybeanArc/

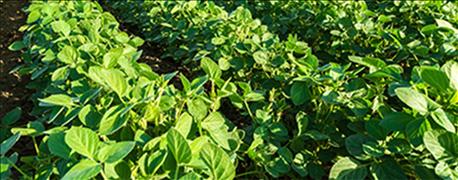
Good yields could also affect payments received under popular revenue-based farm programs, with soybean producers most at risk according to a new Farm Futures study. (Photo: oticki/Thinkstock)
To be sure, these initial forecasts are highly preliminary. USDA doesn’t even finalize payments for 2015 crops until October and won’t report county-level yields for 2016 until February. So, even our estimate of 2015 payments is only a guess. And insufficient data makes it hard to forecast yields and payments for many counties.

But forecasting yields with a model using satellite-based Vegetation Health Index maps provides a first glimpse at both county corn and soybean yields for 2016, and payments they could trigger. In addition to the maps here, we’ve created interactive, online maps that let many growers check out their potential yields, as well as calculation of payments, if any.

ARC-County guarantees participating growers 86% of their so-called “benchmark” revenues, calculated by multiplying the Olympic averages of prices and yields for the previous five years. Olympic averages toss out the high and low of the five years, average the remaining three. Actual revenues for a county are figured by multiplying the average U.S. crop year price times the county’s average yield per planted acre.
Farmers received the difference between the guarantee and actual, up to 10% of the benchmark on 85% of their base acres for the crop. Actual payments farmers received for 2014 crops last fall were also reduced by budget sequestration cutbacks expected to affect amounts sent out this October.
Soybean ARC payments could take a hit for the 2016 crop from two sources. First, the price guarantee for the crop should be down, from the $12.27 used in 2014 and 2015, to an estimated $11.87. At the same time the average cash price for 2016 soybeans is expected to be $9.15, compared to $8.95 for 2015. Yields are also forecast to rise; USDA put the average 2016 yield Aug. 12 at a record 48.9 bpa, compared to 48 bpa for 2015.

The 2015 price is actually up 15 cents for the projection used in estimates for 2015 payments we made in February. Still, we project average county payments of $28 for 2015 soybeans, with only 28% of counties getting nothing. By contrast, the higher yields and prices projected for 2016, along with the lower guarantee, cut our average projected county payment to $15, with 46% of counties getting nothing.

The average projected yields for 2016 corn and soybeans generated by our VHI model were close to the estimates USDA made Aug. 12. The agency put the nationwide corn yield at 175.1 per harvested acre – yields per planted acre can be a little lower. But even with the lower guaranteed price ($4.79 for 2016 vs $5.29 for 2015), the lower average cash price for 2016 corn could increase payments slightly, with more counties getting something. Our projected 2016 corn ARC average is $55, up $4, with only 12% of counties getting nothing
The interactive maps include results only for counties where yields showed a statistically significant correlation with the VHI. Click the marker over a county to find its projected yield. The pop-up box also includes our estimate for the county’s 2016 ARC yield, benchmark revenue, guaranteed revenue, actual revenue and projected payment. You may have to click “refresh” on your browser to display all the counties. You can also zoom in or out with your browser by hitting the “+/-“ button, or using the mouse’s wheel.
Click on the link below for more charts.
About the Author(s)
You May Also Like


