April 4, 2017

By Steve Johnson
The ability to look at corn and soybean futures charts for technical signals to use in marketing your grain can be challenging. Most of the agricultural media and commodity market analysts are focused only on fundamentals: supply-and-demand factors. Some examples in the past few months were weather in South America and the potential size of the soybean crops in Brazil and Argentina.
In late November the news centered on dry planting conditions in Brazil and wet weather in Argentina. Planted acres in Brazil were expected to be large, but very few weather concerns emerged. By mid-January, large rainfall events hit Argentina, and potential yield losses grabbed the headlines.
Head-and-shoulders top in soybeans
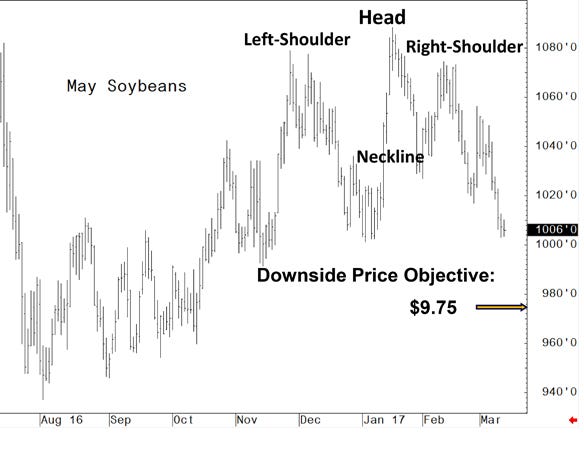
Weather uncertainty in South America provided the best marketing opportunities for futures prices since Thanksgiving. Take a look at the May soybean futures chart below. The highest futures prices occurred last summer and again in late November and mid-January.
Looking back, the formation of a head-and-shoulders top was actually taking place. The Jan. 18 high of $10.88 confirmed the head, but missing was the confirmation of a right shoulder. That didn’t occur until early February. Now, identify the neckline about $10.30, and the math is easy.
Measure the distance from the head to the neckline, or about 58 cents. The downside price objective is roughly this same distance, or about $9.72. That’s exactly the price objective that was reached by late March.

A lesson learned from these signals
Technical chart signals aren’t always easy to detect nor measure with much preciseness until the event occurs. We see this formation in a corn or soybean futures chart only every two to three years. Remember, most market analysts typically only focus on the market fundamentals and don’t like to convey negative news.
By February, the large U.S.-planted soybean acreage forecast became the headline news. Commodity funds that had remained “long soybean futures” for nearly one year suddenly reversed their positions and went “short soybean futures.” The downside price objective could have been projected in the May contract before it actually occurred.
Perhaps the best lesson learned is to have market discipline and determine this potential downside price risk in the market earlier. No one person or market adviser will know for sure.
Another factor this winter was basis (cash minus the futures price). As the soybean futures prices peaked, the basis widened as the local supply of soybeans overwhelmed the cash market.
Farmers with record yields and cash flow needs rewarded the market with cash sales. By February, the export demand for U.S. soybeans had already declined, and soybean processors were the primary source of cash demand. You can expect this wider basis to remain a concern until the supply of soybeans flowing to the processors declines.
Fibonacci retracements for corn
The good, yet old news is that the corn futures market saw only about a 30-cent decline from the February highs. Nearly 85% of the world’s corn is produced in the Northern Hemisphere, unlike soybeans. Futures prices tend to bounce higher during the spring months with the uncertainty of corn production globally.
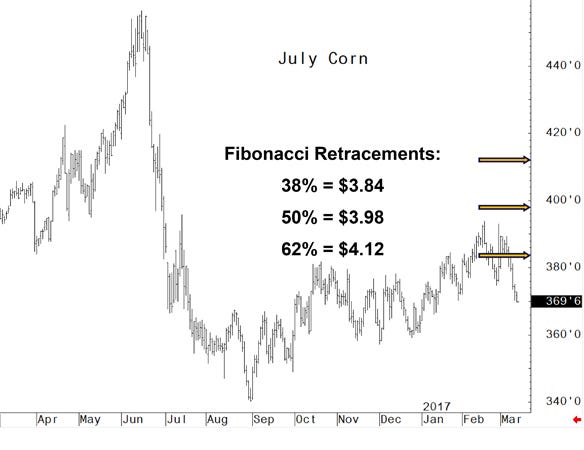
Let’s use Fibonacci Retracements to try to measure the potential for the July corn futures contract to retrace its movement from high to low life-of-contract price levels.

This would leave price objectives for the July corn contract at levels around $3.84, $3.98 and $4.12 per bushel, respectively. The $3.84 per bushel objective was reached by early February. This market has since declined to levels close to $3.62 per bushel. Expect the uncertainty of weather and its impact on planting to be the primary driver of higher futures prices.
Note this July corn contract goes into delivery approximately June 29. Use the last full week of June as the deadline to get most of your old crop bushels priced. This is despite that the USDA will release both Planted Acreage and Quarterly Grain Stock Reports on Friday, June 30. You need to have the discipline to “short” corn futures.
Thus, both a time objective and price objectives should be considered in developing your old-crop marketing plan. If your price objective is not met, then use the time objective.
When determining a price objective for pricing the balance of your old-crop bushels, consider the use of these Fibonacci retracement levels around $3.84, $3.98 and $4.12 per bushel.
Lessons learned from studying the charts
Learning how to identify and use technical chart signals to help you market your crops is helpful. There is no one technical chart signal that works 100% of the time. However, you should consider that many speculators and market analysts participating in the commodity markets often use this same type of technical chart signals.
Farmers who were prepared to take advantage of the recent winter pricing opportunities were well rewarded. This holds true for both old- and new-crop corn and soybean sales.
Finish developing your written marketing plans now so those plans can provide you with some emotional discipline for the volatile period that typically occurs in the spring and summer months. Move beyond the typical outlook and fundamental information that is already reflected in futures market prices.
For more farm information and analysis, visit ISU’s Ag Decision Maker site at extension.iastate.edu/agdm.
Johnson is the Iowa State University Extension farm management specialist for central Iowa. Contact him at [email protected].
You May Also Like


