Most prices over time are displayed as nominal prices, indicating the numeric value of the item. This, however, can be misleading due to the declining purchasing power of money over time leading to increases in price, or inflation. Inflation can easily be conceptualized in the housing market.
In 1980, the average price of a home in the United States was $80,000, while in 2023 the average house price was estimated at $513,000. The function of the home has not changed, but the numerical value has changed dramatically. To compare values over time, economists will transform nominal values into real values. The nominal price is the value of an item in dollars that are not adjusted for the value of the dollar over time. Real prices are an item’s nominal value adjusted for inflation and thus measure that value in terms of other items, over time. In the housing price example, the $80,000 average price in 1980 would be $238,320 in 2023 dollars.
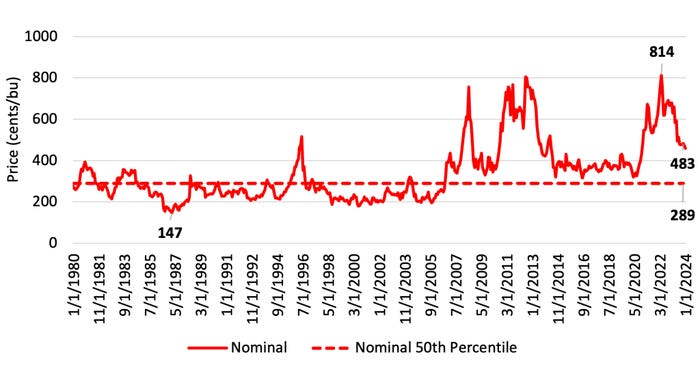
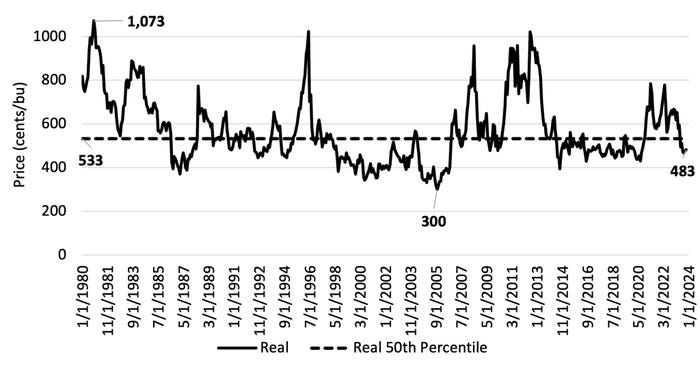
This article adjusts nominal nearby corn futures prices from 1980 to 2023 to real prices. The baseline month for real prices for this analysis is November 2023. For November 2023, nominal price = real price = $4.83. See Figures 1 & 2.
Since 1980, the monthly average corn futures price (nominal price) has averaged $2.89/bu. The highest monthly average price was in April 2022 at $8.14/bu, and the lowest monthly average price was $1.47/bu in January 1987. So, comparing the current price of corn – $4.83/bu – would indicate that although prices are down from the recent high, prices are still nearly $2.00 above the long-term average.
Examining real monthly nearby corn futures prices provides a very different comparison. The current price is the same $4.83/bu; however, this is $0.50/bu below the 1980 to 2023 real average price of $5.33/bu. The current price is near the price range from 2014 to 2020, a period that few corn farmers would associate with high prices. For real prices (in November 2023 dollars), the high and low occurred October 1980 at $10.73/bu and September 2005 at $3.00/bu.
So, are corn prices high or low? Like all good economic questions, it depends. Analyzing real prices can be beneficial to provide historical context and allow for a comparison considering the same purchasing power. Decisions can then be based on longer-term price cycles and trends.

Figure 1. Monthly Nominal Nearby Corn Futures Prices, 1980-2023

Figure 2. Monthly Real Nearby Corn Futures Prices, 1980-2023 (Base = November 2023)
Smith is a University of Tennessee Extension Economist.
Source: Southern Ag Today, a collaboration of economists from 13 Southern universities.
Read more about:
Corn FuturesAbout the Author(s)
You May Also Like


