Weather concerns and strengthening demand helped fuel a strong grain price rally this fall. But another factor that had nothing to do with weather or exports sidetracked gains last week. Nervousness about U.S. politics and uncertainty over COVID-19 battered global stock markets, bearishness that weakened commodities from corn to crude oil.
No one knows how the election will turn out, or how long it will take to determine a winner. And the course of the pandemic is only one worry for a world that’s also contending with recession, Brexit, and a number of foreign policy crises.
Still, while the S&P 500 likely will continue to grab headlines, other corners of the trading world also could be useful, and perhaps even better barometers of where corn and soybeans are headed. Correlations between crops and these markets provide some clues about what to watch, and why.
Some contracts are familiar to farmers, including the value of the dollar against key currencies. But others, notably copper, don’t typically show up on price screens outside the cash register at the hardware store or lumber yard.
Soybean-stocks correlations
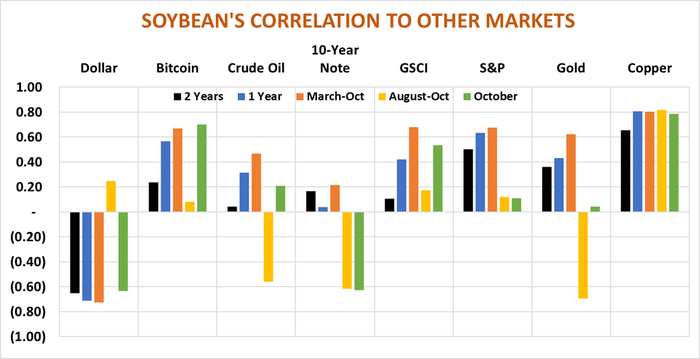
Soybeans historically show a stronger relationship with stocks than corn does, perhaps because they’re favored by hedge fund managers for their big price moves. Despite knee-jerk selling last week, over the past quarter the S&P and grain prices didn’t move much in tandem. Wall Street and La Salle Street both ended higher, but gains or losses on any given day were inconsistent.
Investors appeared focused on what could be, rather than what is in the here and now. Though economic growth in the third quarter of 2020 rebounded at a record pace, gross domestic product remains below pre-pandemic projections, and corporate earnings per share fell back to levels seen in 2017. Stock prices are ignoring those metrics and instead are fairly valued based on what companies expect they’ll be earning in 2022 according to my models.
Those optimistic feelings about the future got a gut check at the end of October. Lack of another round of spending from Washington – so-called fiscal stimulus – added to election and COVID jitters.
Corn and soybean futures showed stronger correlations, at least at times, with several other contracts that illustrate how buying and selling of financial instruments can be just as emotional as the grain market in a hot, dry July.
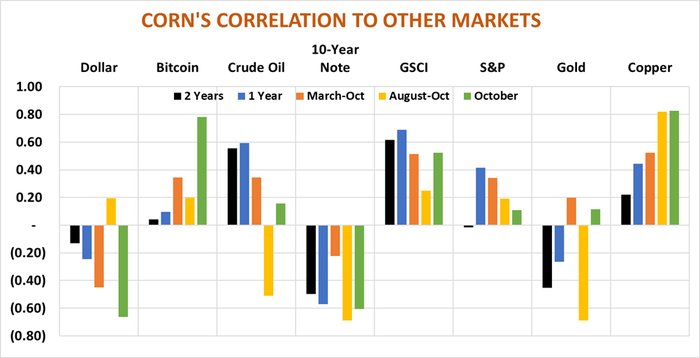
Take currencies, for example. The widely quoted ICE dollar index follows the value of the greenback against six other currencies. DX showed a modest positive correlation to both corn and soybeans over the last three months. That is, when the dollar was stronger, corn and beans showed a tendency to rise. When the currency weakened, so did corn and beans.
But over the past month, and longer term too for the last two years, the correlation between crops and the currency was negative. Grain prices tended to fall when the dollar strengthened, gaining support when the buck weakened.
Dollar as safe haven
Some of these gyrations reflect the dollar’s status as a safe haven. Investors tend to buy bucks for mattress stuffing when they’re fearful of a downturn on Wall Street. Dollar selling, by contrast, at times is a sign of a risk-on mood, euphoria that can spill over into an array of other markets. The cheaper dollar also favors commodities denominated in the world’s reserve currency.
The dollar moves for other reasons besides safety. Over the long haul a currency’s values in part reflect what investors can earn on the country’s debt, as measured in interest rates. One reason for buying dollars is the expectation of making money with a risk-free investment. Sure, U.S. interest rates are pretty much near record lows. But inflation-adjusted rates in other countries are in the red – and there are a few smoke clouds that suggest at least a whiff of higher rates here.
While the size of that next round of COVID budget stimulus is unknown, it will only add to a federal budget deficit that’s well past nose-bleed territory. Sure, whoever’s running the government won’t want to pay higher interest rates to fund that debt. But, they may not have much choice if the market thinks otherwise. The Federal Reserve, which starts its next two-day meeting on monetary policy Wednesday, could be forced to raise rates if all the debt begins to fuel inflation.
The risk of rising prices likely is a long shot. The Fed has signaled “lower, for longer,” adjusting its philosophy to allow for inflation hotter than the official 2% target after periods of weak prices – which is coincidentally the environment of the last decade.
The potential for fiscal stimulus could play into another theme. The U.S. needs lots of concrete and rebar to fix years of neglected infrastructure. But whatever happens here may be dwarfed elsewhere. China isn’t just buying soybeans and other ag products from the U.S. After several years of subdued economic growth, the world’s largest country has ramped up spending on infrastructure as it recovers from the pandemic ahead of Western countries. Other governments around the world are following suit.
Once upon a time that might have been bullish for crude oil. Energy indeed was a proxy for the economy until 2020. But a price war in OPEC, record U.S. production and the green revolution made petroleum the orphan stepchild of hard asset benchmarks used by traders, such as the Goldman Sachs Commodity Index.
The world still needs…copper
The world still needs “stuff.” But that stuff is the stuff that fuels the new economy. There are a lot of new hot tickets. What ties them together is electricity. Whether it’s internet, cell phones, wind farms or just population growth, you need wire, and that wire is made of copper.
HG, as it’s known on the periodic table of elements, showed a positive correlation with corn and soybeans in October. And unlike other asset contracts, for soybeans relationship was consistently strong over the past two years.
“Correlation is not causation.” That’s rule number one of crunching numbers. So, joining copper and crops at the hip could be a fluke. Sometimes a rising tide lifts all boats, sometimes not.
But while corn and soybeans were rallying in October, so too was Bitcoin. My forecasting models show the ICE dollar index is fairly valued after a pullback in 2020. But Bitcoin, unlike the dollar, showed a consistent correlational direction to corn and soybeans over the periods measured in the charts below. Perhaps the cybercurrency melded the zeitgeist of the moment best: Buy new commodities in the new currency.


These charts show the statistical correlation between corn and soybean futures and several other markets at various intervals over the past two years. Correlations range from +1, which is positive, and -1, which is negative. A positive correlation means two variables tend to move in the same direction. A negative correlation shows the contracts tended to move in opposite directions.
Read more about:
Grain MarketsAbout the Author(s)
You May Also Like


