A wet week across parts of the Corn Belt and forecasts for cool temperatures over the next two weeks should continue to turn talk in the grain market from tight old crop stocks to the potential for 2021 production.
A slow start to planting would raise questions about whether farmers will be able to increase acreage beyond the intentions USDA published at the end of March. And the pace of seeding could also become important when traders start to make early guesses about yields, especially for corn.
Timeliness is more than a virtue for impressing neighbors and landlords. A fast-planted corn crop has greater yield potential, while delays can limit bushels growers ultimately harvest. Traders like to see 85% of the corn crop planted by mid-May, though the long-term average is around 80%.
Corn planting speed also figures into a popular model of corn yields developed by USDA statisticians, that incorporates June stress on the crop and July temperatures and precipitation.
Those factors are only one way to estimate yields long before the combines run. Indeed, armed with artificial intelligence and high-resolution satellites, analysts will tout a variety of yield forecasts in coming months. But there’s a much easier way to get a handle on how crops are faring. Weekly USDA crop progress reports put out most Mondays at 3 p.m. CDT came under a lot of fire in recent years. But they continue to provide a reliable way of forecasting yields. Ratings for corn typically begin in mid-May with soybean reports following in the beginning of June.
Spot on in 2020
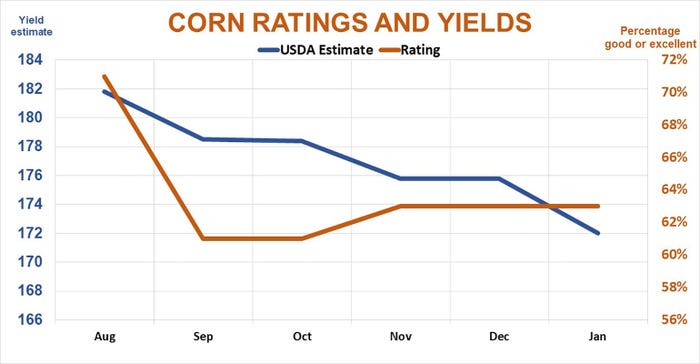
The percentage of the corn crop rated good to excellent at the end of the growing season accounts for more than 95% of the variance in corn yields. Last year this model put the corn yield at 171.8, mere tenths of a bushel from USDA’s January estimate of 172 bpa.
That’s better than other methods, including all those tech-heavy calculations. Most of these forecasts continued to call for better than average yields until USDA shocked the market with its final monthly estimates in January.
The crop ratings method, by contrast, homed in on its field forecast just after Labor Day.
For sure, this national ratings model doesn’t always hit the mark. Most of the time it’s within a bushel or two of USDA’s final number. But it missed widely a couple of years, including 2012, when it overestimated the yield by 10 bushels per acre.
That’s why I like to make projections using other methods, too, including the weather model and historical comparisons of the U.S. Cropland Vegetative Health Index published by the National Weather Service. The VHI is based on satellite imagery, so it’s not exactly low-tech. But my model doesn’t include any machine learning or other fancy stuff. Just one number per week is needed. A simple regression analysis last year using the reading from the start of September – week 35 of the calendar year -- spat out a corn yield of 174.3 bpa. USDA’s September yield came in at 178.5 bpa. That was down from the agency’s initial projection of 181.8 bpa in August, when the weather model was at 178.9, and soon there were indications production losses might be happening after drought and derecho.
Both crop ratings and the VHI declined sharply in August, suggesting greater losses than USDA picked up in its surveys of farmers and their fields.
Watch soybean changes
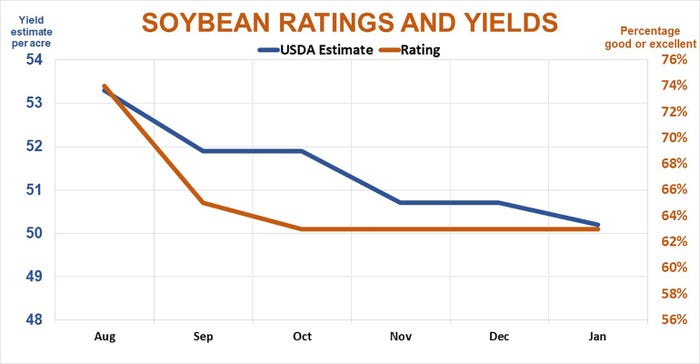
Indeed, changes in these readings can be a tip-off of things to come for soybeans. Ratings aren’t as reliable for soybeans as corn. That reflects the difficulty even veteran farmers face predicting yields during the growing season, with crops sometimes damaged early or made late. But last year the change in the percentage of the soybean crop rated good to excellent was an excellent predictor that yields would be close to normal. Ratings normally start strong, then taper off, the pattern followed in 2020.
The weather model for soybeans, based on July and August weather, planting speed and June stress, put the soybean yield at 49.8 bpa. That projection came in early September, when USDA pegged yields at 51.9 bpa, down from 53.3 in August. As with corn, the soybean VHI dropped sharply in August, pointing to yields in at the start of September at 50.3 bp, just one-tenth more than USDA’s last estimate in January.
Combining all these factors into a multiple regression model improves accuracy a little for soybean yield estimates, but doesn’t help corn. And with both of these models there’s statistical error: 3.3% for corn and 2.4% for soybeans.
That’s a reminder: Don’t put your money on any one estimate. Even USDA gets multiple kicks at the can, sometimes revising its “annual” January estimates in September or after the Ag Census every five years. Like the markets, yield estimates are a moving target.
Knorr writes from Chicago, Ill. Email him at [email protected]
The opinions of the author are not necessarily those of Farm Futures or Farm Progress.
About the Author(s)
You May Also Like


