A recent report from Nebraska Farm Business Inc. outlining farm financial averages for last year shows 2017 was the fifth year in a row with lower accrual net farm incomes than seen for the eight years prior.
“Even though income is up a little bit, we're nowhere near where we were,” says Tina Barrett, executive director of Nebraska Farm Business. “It hasn't rebounded yet.”
This report is compiled from analysis of 120 farms in Nebraska, and it accounts for the total amount of income and expenses attributed to the 2017 cropping season.
The report showed crop operations that receive over 70% of their net farm income from the sale of crops saw a 20% decline in net farm income from 2016 to 2017. Meanwhile, operations with a bigger beef influence saw smaller losses, as fed cattle prices saw slight increases in the first half of 2017.
Financial stress showing
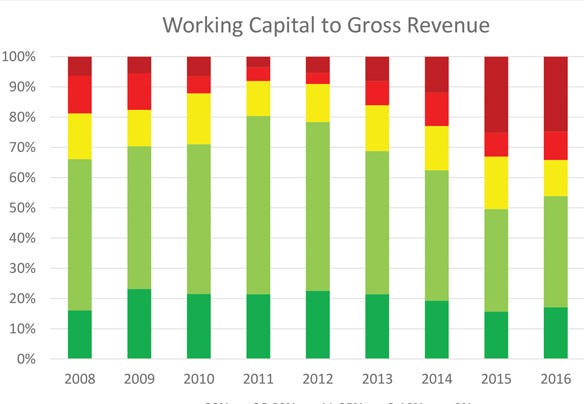
Financial stress is showing most significantly in the working capital to gross revenue ratio, or the current assets minus current debt (working capital) divided by gross revenue.
“We like to see the ratio in that 30% to 35% range, and we're seeing that continue to decline on average,” Barrett says. “That indicates a cash flow problem. The lower that number is, the more difficult it will be to pay those debts.”
What's also concerning is the growing division. About half the operations are doing well and the other half are in cash flow trouble. Also, fewer farms are in the category with a 11% to 25% ratio.
“The number of farms in a bad situation continues to get bigger. But what we can't tell from averages is how many of those farms continue to stay in a high ratio and how many move between categories each year. If a farm was in a tight working capital position, a lender might restructure that debt, so it's paid off over the long term,” Barrett says. “It's going to improve cash flow because the grower doesn't have to pay it back right now; it's over a longer term. That only works as long as there's equity on the balance sheet.”

The percentage of farms in the “red” are in a position that is not healthy. “Yellow” means caution is needed, and “green” means they're good to go. The chart shows that the number of farms in yellow is “squeezing,” meaning there's a division between farms in good financial health and those with cash flow trouble. (Charts courtesy of Tina Barrett)

Debt-to-asset ratios are seeing the same squeeze, with more farms moving into a ratio exceeding 80%. Barrett notes each year since 2009 has seen an increase in the average amount of total debt among farmers, and 2017 was no exception. Average debt rose 10% to $1.3 million. The biggest increase was in long-term debt, such as land. However, Barrett notes this is likely due to restructuring of current debt, rather than the purchase of additional land assets.

In 2017, average debt rose to over $1.3 million. The largest increase was in the long-term position, which is likely due to restructuring of current debt, rather than asset acquisition, since the average amount spent on land was down compared to 2016.

The average cost of production in 2017 was relatively unchanged, although costs were more concentrated in some cases than previous years. Notably, higher cash rents came down to more reasonable rates, with cash rents above $300 per acre no longer being reported. And it's apparent that more operations are adjusting to lower their cost of production compared to the previous two years.

Each dot represents one farm's cost of production for irrigated corn on cash rented ground. The cost of production in 2017 was much more concentrated than the previous two years, indicating higher cash rents are coming down to a more reasonable rate. The chart also shows more blue dots to the left for 2017, indicating more operations are making an adjustment to a lower cost of production.

Living expenses shifting
Although family living expenses saw a reduction of about 10% from 2015 to 2016, they went back to 2012 levels in 2017. One major contributor to the increase was health care. The combined increase between medical care and health insurance was almost $3,000, or 18.5% of the increase. Meanwhile, recreation and miscellaneous expenses accounted for over a third of the increase.
However, there was a decrease in non-farm capital purchases, income and Social Security taxes, which kept the total amount of non-farm costs at roughly the same level as 2016.
“If we add in investments and retirement, and non-farm capital purchases like houses, the total amount of dollars stayed the same from 2016 to 2017,” Barrett says. “So farmers have shifted those investments in savings to out-of-pocket expenses. It's not necessarily more dollars out of the farm, but instead of saving that money, it's being spent on things that are gone. It's cash that probably isn't coming back into the operation at another time.”
And Barrett adds it's important to remember there's plenty of variability among the data reported.
“We can talk about averages, but that just means there's one farm doing well and another farm not doing well on the other side. It's important for producers to know where they're at, where their operation is at, and where it's trending, because an average is just an average. If you're looking at average numbers and thinking the average is OK, you should make sure you're not on the wrong side of average and assuming you're OK,” she says. “There's a really wide range even within these 120 farms in terms of profitability.”
About the Author(s)
You May Also Like


