Financial benchmark tool provides perspective on farm operation
Think DifferentAaron Lee, Salem, Ind., farmer, has a customized form showing cash flow, expected cash draws, grain inventories, operating loan status and the weekly weather forecast one month and six months out. He and his family can also determine cash flow by field our cash flows, rents, and keep better records on crop inputs.“You have to be ‘all in’ for financial benchmarking to work, he says. “Benchmarking with other farmers is relationship-driven. It takes time to build trust and share all of your data, but it’s well worth the effort."
November 5, 2013

Aaron Lee has a simple, 1-page form he checks at least weekly for a quick glance of his farm's financial situation. The Salem, Ind., fifth-generation corn and soybean farmer at Cornerstone Family Farms, says the "financial dashboard" keeps the farm on track, especially in today's tightening margin environment.
"We’ve customized our form to include cash flow, expected cash draws, grain inventories, operating loan status and the weekly weather forecast," says Lee, who farms with his wife, parents and sister and brother-in-law. "We look at financials one month and six months out. With the farm economy where it is, every dollar can make a huge difference. You have to prepare during the good times to manage the bad times."
Lee adopted the concept after Cornerstone Family Farms joined the Brighton, Ill.,-based FamilyFarms Group in 2008. He’s one of 13 farmers nationwide that participates in a general manager benchmarking program he joined after his dad began to transition the operation to him. Benchmarking, a commonly used success measuring stick in other industries, allows participating farmers to compare their financial data against other similar operations.
The practice is becoming more prevalent in agriculture, says Jeff Haferkamp, chief operating officer for FamilyFarms Group. “We know it works. Within our general manager group, farmers share such details as working capital ratios, loanable entities and free cash-flow projections and then break it down by crop. We keep finding new layers to compare."
The benchmarking process includes, but goes beyond, the obvious crop input costs and revenue to include a closer look at basis, machinery efficiency, cash rent and employee salaries and benefits. The group compares notes on types of acres, including single- versus double-crop and non-irrigated versus irrigated. All data remains confidential, and must be consistent and comprehensive to be effective.
"Neighbors don't talk about these kinds of specifics because they’re competitors.” It’s better to talk with like-minded farmers from other regions, says Lee. "For example, with a bigger crop this year, we explored storage options and learned more about costs associated with bagging grain, to decide whether we wanted to implement the practice."
Benchmarking also helped Lee move from a simple recordkeeping system that tracked input costs and revenues to something more complete. The family implemented new software in 2009 to capture more detail; moving from whole-farm tracking to crop tracking to now tracking both.
We can determine our cash flows and rents by field, and keep better records on crop inputs," says Lee.
"I also am confident that if we had a spot check from the government, our records would meet regulations."
Jim Sladek, JCS Family Farms, Iowa City, Iowa, is also part of the group. "We started financial benchmarking last year. This year we are looking at profit and loss statements and balance sheets by crop," he says. "This really opens my eyes where I need to focus and what I can impact now instead of waiting until end of the year end and making adjustments."
Sladek makes a budget and compares it to actual on a monthly basis and adjusts where needed. During the 2012 summer drought, he was able to make a fairly accurate estimate of his fall position and take it to his lender before the lender asked about the farm's financial position.
"We were able to be proactive and show we were in the black," he says. "As it turns out, we were very close with our year-end estimate and able to build confidence with our lender."
Benchmark yourself
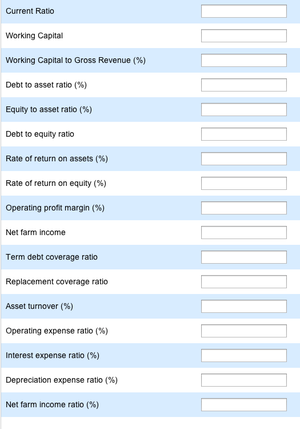
Here is a sample farm dashboard with key financial ratios that indicate your financial health. The categories are listed as the Farm Financial Standards Council recommends; liquidity, solvency, profitability, repayment capacity and efficiency.

While the categories may be of equal importance to an operation, Dale Nordquist, University of Minnesota Center for Farm Financial Management associate director, suggests the most important measures within each category may be as follows:
Liquidity –working capital to gross revenue
Solvency –debt to assets ratio
Profitability –rate of return on assets
Repayment capacity –term debt coverage ratio
Efficiency –operating expense ratio
The "average" column reflects 2,939 farms' average values. Users who view Minnesota data, see data from farmers who participate in MnSCU Farm Business Management and the Southwest Minnesota Farm Business Management Association. Individual farms work with representatives to complete detailed financial analyses at the close of each year. The analyses are compiled into the FINBIN database.
At the whole-farm ratio level, this data can be used with care by farmers in other states, although Nordquist cautions farmers will see some regional differences in certain years.
To complete a dashboard online, go to http://www.finbin.umn.edu/WholeFarmBenchmarking/default.aspx. The site has a handy option for those who don't know their ratios, where it will calculate them for you.
About the Author(s)
You May Also Like


