August 27, 2019

Brent Gloy takes a look back at cash rents over the years in his latest blog. The central question in 2014 was where rents were headed. We concluded that annual large declines (in excess of 10%) were relatively rare and that if rents were to continue to decline you would likely see it play out over several years unless commodity prices rebounded. Unfortunately, it turns out that commodity prices haven’t recovered and rents (and land prices) have drifted lower. This week we will take a look at whether rents have fallen enough, or whether further declines are likely.
Cash Rents Fall a Bit
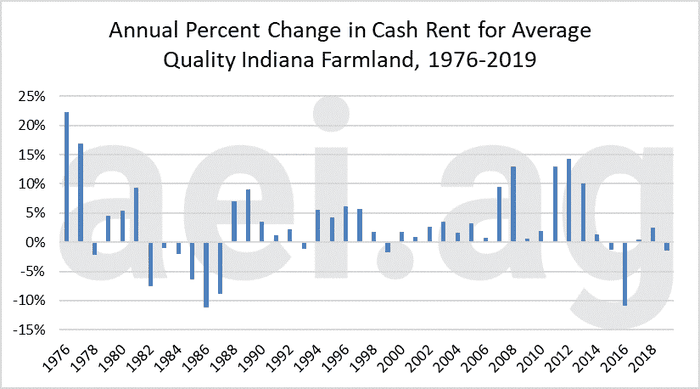
Figure 1 shows the annual percentage change in cash rents from 1976 to 2019. This is the same data set that we used to look at Indiana farmland values a couple of weeks ago. One of the questions I often get is whether cash rents ever go down. It may seem like an odd question, but when you look at the data, you can see why people would ask. Rents do go down, but not that often. Over that entire time period, the cash rental rate on average quality Indiana farmland has fallen only 12 out of 44 years (27% of the time).
While they don’t fall that often, the declines tend to go in streaks. For instance, from 1982-1988 rents declined every year. The total decline in that period was 37%. More recently, from 2015 to 2019 rents have declined in 3 out of five years (a small increase in 2017, 0.4%, kept it from being 4 of 5). The cumulative decline over this time has been 11%. The key question is whether these declines have brought rents back into line with farm returns, or whether there is still room for additional declines.

Figure 1. Annual Percent Change in Cash Rent for Average Quality Indiana Farmland, 1976-2019.
Rent per Bushel Moderates
One metric that is frequently used to evaluate cash rents is cash rent per bushel. This is calculated by dividing cash rent by the expected productivity of the farmland. This is a decent measure of the price of farmland rent because it takes into account the increases in productivity (yields) that occur through time.
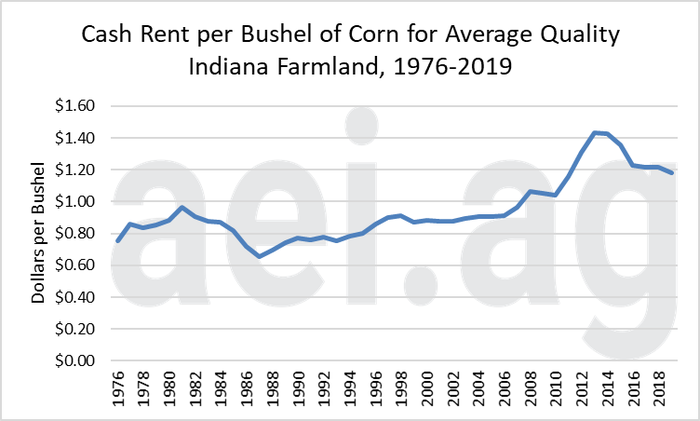
The Indiana survey is nice because it requires respondents to report the expected productivity of the land in bushels of corn. The ratio of cash rent to bushels of corn is shown in Figure 2. After a rapid escalation from 2010 to 2013, rent per bushel moderated and has since fallen. After peaking at $1.43 per bushel it now stands at $1.18 per bushel.
While the cost per bushel of expected productivity has fallen by 17% is remains elevated from the perspective of history. At present, it is the 8th highest value in the data. Additionally, cash rent per bushel metric does not account for changes in commodity prices or cost structure.

Figure 2. Cash Rent per Bushel of Expected Corn Yield for Average Quality Indiana Farmland, 1976-2019.
Rents Relative to Revenue
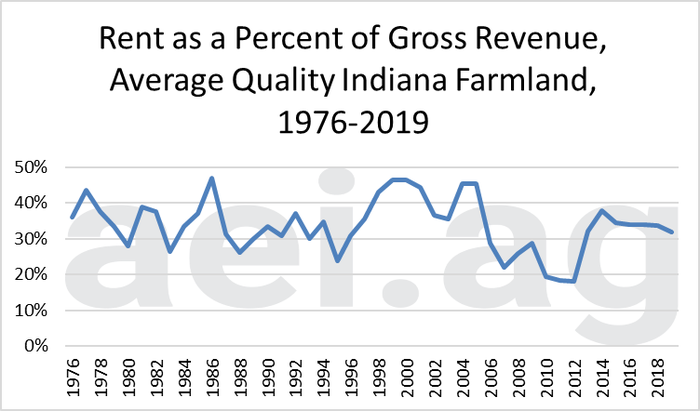
To account for differences in commodity prices we can compare cash rents to the gross revenue associated with farmland. To estimate revenue, we multiplied the expected productivity of the farmland by the market year average price of corn received in Indiana. For 2019 we used the latest price projected in the WASDE report. Figure 3 shows cash rent divided by estimated gross revenue for average quality Indiana farmland.

Figure 3. Rent as a Percent of Gross Revenue, Average Quality Indiana Farmland, 1976-2019.
Because commodity prices can be quite volatile, this measure has exhibited much more variability than the rent per bushel measure. Today, rent consumes slightly over 30% of estimated gross revenue. The rent to revenue ratio peaked at 37% in 2014 and has since declined to 32% today. In percentage terms, this decline is very close (15% decline) to the decline in the simple cash rent per bushel average.
By visual inspection, this ratio does not appear that high in the context of the data. However, it is important to remember that the revenue estimates do not include government program payments. This omission has the impact of overstating the percent of revenue that goes to cash rent, and particularly so in years when government program payments were high. This helps explain the period in the late 1990s government programs were very high and the rent to revenue ratio exceeded 40%. In contrast, in 2014 government program payments were lower and the ratio remained elevated.
Rent Relative to Contribution Margin Remains Very High
In order to look at the impact of changes in cost structure as well as the impact of government program payments, we combined the land value survey data with the Purdue crop budget data. The downside is that the crop budgets only go back to 1991. The contribution margin estimated in the Purdue budget takes into account changes in variable cost structure as well as government program payments. As a reminder, the contribution margin is an estimate of the amount that the farmer has available to cover land rent and meet the fixed costs of production.
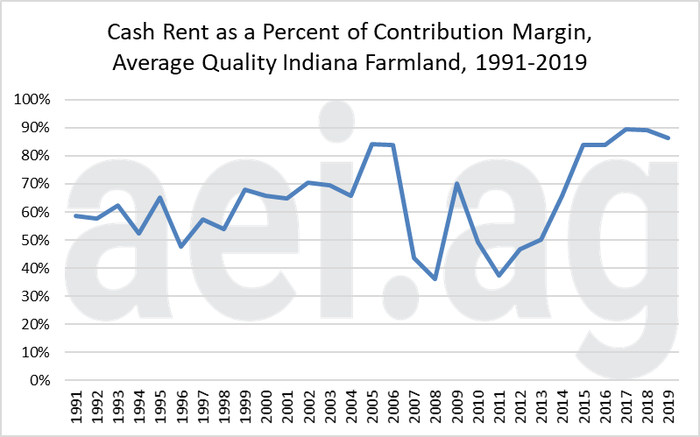
Figure 4 shows the ratio of cash rent to contribution margin. As this ratio approaches 100% cash rent consumes nearly all of the contribution margin, leaving the farmer little to cover the cost of equipment and other unpaid resources like family labor. Today, the ratio remains elevated at 86%. As one can see, this ratio can also be quite volatile. It was clearly very low in the mid 2000’s to the late 2010’s, times of strong farm profitability. However, at present, it remains quite high. With only 14% of gross revenue left to cover the remaining costs of production, most farmers are experiencing economic losses at these rent levels.

Figure 4. Cash Rent as a Percent of Contribution Margin, Average Quality Indiana Farmland, 1991-2019.
Wrapping it Up
Cash rental decisions are one of the most difficult decisions facing farmers. They represent a major expense for farmers and present a large source of risk (both upside and downside). Further, changes to the land base impact the farm’s fixed cost structure.
After a period of rapid increases, rents have indeed moderated. By some measures, the declines have helped to bring rents back to the current economic realities facing farmers. However, when compared to the contribution margin it appears that rents remain quite elevated and could be due for further declines.
As we pointed out several years ago, large declines in cash rental rates are relatively rare occurrences. Instead, declines tend to play out over a period of years. Given the current state of the farm economy, there is little reason to think that rent increases should be anywhere on the horizon. In fact, if the ad hoc government program payments (MFP 1.0, 2.0, 3.0?, ???) were to disappear, the economic pressure in the farm sector would become even more intense. As we have been saying for some time, the farm economy needs some good news. Absent that, we look for further moderation in cash rents.
Source: Agricultural Economic Insights
The source is solely responsible for the information provided and is wholly owned by the source. Informa Business Media and all its subsidiaries are not responsible for any of the content contained in this information asset.
Read more about:
Cash RentAbout the Author(s)
You May Also Like


