Farm program payments to corn and soybean growers in the final year of the 2014 bill won’t provide as much support to growers already stressed by weather, low prices and faltering farm income.
While farmers won’t get checks until October, county yields for many areas published this week suggests fewer farmers will receive ARC County payments for corn and soybeans for 2018 crops. And average payments to those who do likely will be lower.
Farm Futures initial assessment of program payments comes with a few caveats. First, county yields published by USDA’s National Agricultural Statistics Service don’t yet include many counties around the country. And the agency puts out yields per harvested acre, while ARC payments are made on yields per planted acre. The Farm Service Agency, which administers the ARC programs, will put out final yields for all participating counties later in the year. But these initial yields typically provide an early idea of what farmers can expect.
Not much, as it turns out.
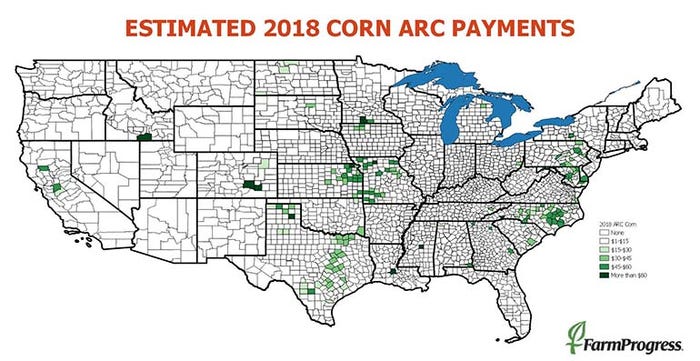
Our projections show only 16% of corn counties receiving a payment, with the average running around $34.50. While that’s only a couple bucks sky of the $36.60 average for 2017, 29% of counties received an ARC payment on 2017 corn.
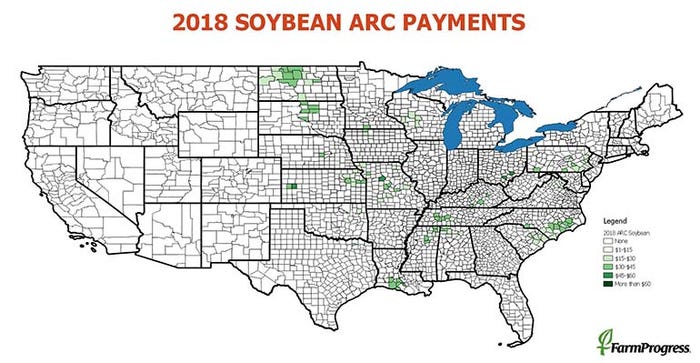
For soybeans, this initial look shows payments average $20.73 cents. Just 17% of counties would qualify, down from 33% in 2017, when payments averaged $26.66.
The early years of the ARC program provided high revenue guarantees, thanks to prices coming off their strong performance from 2009-2013. Price guarantees faded substantially since those boom years. That means growers receiving payments for 2018 crops likely suffered yield losses due to natural disasters. Some counties in the Carolinas will be eligible for 2018 crops ruined by Hurricane Florence, for example.
Yields for most growers used in the 2014 farm bill were based on NASS data, which comes from that agency’s surveys of farmers and their fields. But the new version of ARC in place for 2019 will be based on yields farmers reported to the Risk Management Agency for crop insurance. The yields will also be adjusted to reflect trend yields, which are generally higher.
In addition to county-level maps of potential payments for corn and soybeans, we also prepared interactive Google Maps. Click on the symbols for a county to bring up a box showing how we calculated the payment for 2018. Payments are made on 85% of base acres and these estimates to no include the impact of budget sequestration if any.


About the Author(s)
You May Also Like


