*This is the seventh article in our 2024 Southwest Economic Outlook series. Hear from Oklahoma State University and OSU Extension Service, and Texas A&M University and TAMU AgriLife Extension Service economists about the 2024 outlook.

The question of the 2024 cotton outlook begins with planted acres. The price of competing crops, relative to cotton prices, is an important consideration to the level of planted acreage.
At first glance, 2024 appears harder to figure out since new crop prices for everything except maybe peanuts are not particularly strong. Still, history can be a helpful guide.
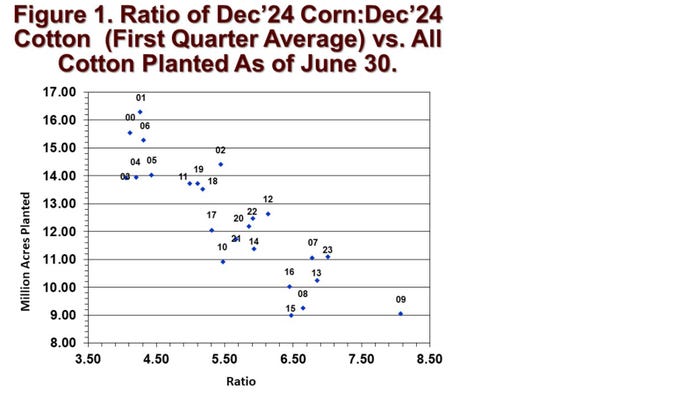
Figure 1 below shows a strong relationship between the level of U.S. upland and Pima cotton planted, as measured on June 30, and the ratio of December CBOT corn futures and ICE cotton futures averaged across first quarter of the year. The higher the ratio, the less cotton is planted.

Of course, there are other important competing crops besides corn such as sorghum, soybeans, peanuts, not to mention forages. And there are other non-price influences, including how dry it was in the Southern Plains region, the insurance base price, fixed cost influences, and the psychological influence of the preceding growing season. The latter influence will be a mixed bag. Delta and Southeastern cotton producers did okay in 2023, while Southern Plains growers experienced 2023 as a major disappointment.
At any rate, the price ratio of corn-to-cotton appears to capture a lot of these other influences in explaining variations in cotton plantings. What does the above chart imply for 2024? The daily new crop corn-to-cotton price ratios have been 6.0 to 6.5 or even higher. For example, on Nov. 2, with Dec’24 corn at $5.14/bu. and Dec’24 cotton at 77.24 cents per pound, the resulting ratio was 6.7. If this ratio persists into the first quarter of next year, it would historically be associated with between 10 and 11 million planted acres of upland and pima combined.
Let’s say planted acreage is 10.5 million. What then? We would assume that El Niño moisture this winter will give below-average abandonment around 10%. That means harvested acres will be 90% of 10.5 million, or around 9.5. Assuming a national average yield of 800 pounds per harvested acre, we can conservatively pencil out a 15.5 to 16 million-bale crop. The latter outcome is several million bales more than was harvested in either 2022 or 2023.
Assuming similar demand influences, including Brazilian competition for exports and fears of slow economic growth, we expect a lower range of prices for upland cotton, perhaps in the low- to mid-70s. We would also expect in-season price volatility around the normal information milestones, such as the March 31 Prospective Plantings report, the May WASDE report, and the June 30 Planted Acreage report.
About the Author(s)
You May Also Like


