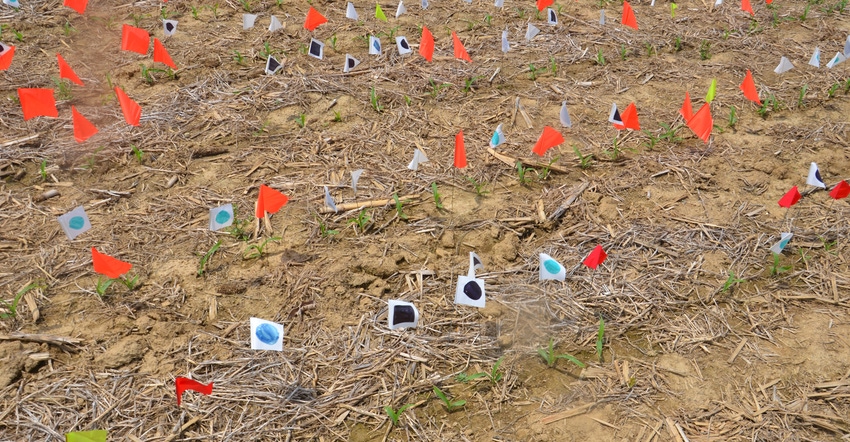
If you could plant corn into reasonably good soil conditions on April 25, many of you would jump at the chance, year in and year out.
That’s when the roughly 60-acre Corn Watch ’21 field was planted. About half the field was planted after a spring tillage pass on soybean stubble, and half was no-tilled directly into soybean stubble. The 24-row planter is equipped for multi-hybrid planting and outfitted with DeltaForce hydraulic down pressure.
Related: Get ready to scout corn all summer
The operator already had planted a large amount of his crop, both corn and soybeans, before he planted this field. Conditions seemed right for uniform emergence and good stands. What he couldn’t anticipate were two 1-inch rains, with several consecutive nights in the mid-30s and daily highs in the 50s and 60s sandwiched in between.
As a result, emergence was spread over 15 days on the conventional side and 14 days on the no-till side, between when the first and last plants emerged. To determine this, eight rows of a 24-row pass on the conventional side and all 24 rows of one pass on the no-till portion were flagged for emergence by days or groups of days.
“We’ll see what happens over the season,” says Dave Nanda, director of genetics for Seed Genetics Direct, sponsor of Corn Watch ’21. Nanda was a corn breeder during most of his career.
“Uniformity of emergence is important, but so is spacing along the row,” Nanda says. Based on what he observed in a demonstration plot in 2020, when emergence was spread out along sections of a row due to cool temperature impacting germination, there appeared to be much less impact on ear size than you would think. This year’s emergence plots will put the theory to the test.
Population shift
The no-till side began emerging 11 days after planting, one day after plants on the conventional side first emerged. From the beginning, there was considerable variation in rate of emergence between rows in both tillage systems. The inconsistency was greater in no-till.
Nineteen days after planting, an average stand count was determined for a complete 24-row pass on the conventional side and a 24-row pass on the no-till side. Day-to-day flagging was discontinued.
The average population across all 24 rows on the conventional side was 27, 500 plants per acre, with individual rows varying between a high and low of 30,000 and 22,000 plants per acre. In no-till, the average was 24,800 plants per acre, with a one-row high of 35,000 and a low of 19,000. Each row represented 1/1,000 of an acre.
Ah, but that’s not the end of the story. Temperatures began warming up after day 19, with lows in the high 40s and 50s, and highs in the 70s, pushing into the low 80s. A final stand count was made on May 20, day 25 after planting. In that six-day window, considerably more plants emerged, especially in no-till.
When the counting was done, the conventional side averaged 29,900 plants per acre, with a high row of 33 and a low row of 27. The no-till portion jumped to an average of 30,600 plants per acre, with a high of 35 and low of 24.
Look for much more detail about row-to-row differences and length of emergence in future articles.
About the Author(s)
You May Also Like


