The soybean export window is shrinking.
USDA dropped 40 million bushels (mbu) in the November WASDE report forecast to 2.050 billion bushels. Its forecast has gyrated between that number as the low and 2.09 billion on the top end since its first release for the 21-22 crop year back in May.
We think there are four cautionary signs suggesting this forecast may fall short of expectations:
Cumulative sales as the year approaches the ¼ mark, at 1.33 billion bushels, are off more than 30%;
Sales to China are down 32%;
The amount on the books to Unknown (largely China) as of Nov. 18 are 37% smaller; and
Sales to Other Far East destinations such as Japan, Taiwan and South Korea as well as important Southeast Asia destinations are also about a third less.
Part of the year-to-year decline reflects the availability of South American soybeans, specifically from Brazil. We estimate the two major South American exporters began the ‘21-22 U.S. crop year with a not-so-small inventory of approximately 2.5 billion bushels, which is close to a 17% increase from a year ago. No surprise then, that U.S. exports have suffered the first three months of 21-22.
Chinese demand
What about Chinese demand? It’s always difficult to get a read on the internal workings of the Chinese economy, but what data we do get indicates the country’s imports of soybeans during the Sep-Oct timeframe are running about 35% behind the year ago pace.
Soybean crush during this same period is off 2.6 MMT/11%. USDA, on the other hand, is forecasting a 5 MMT increase in crush and, expects soybean meal use to rise by close to 4 MMT. Time will tell.
Early Brazil harvest?
The final concern is the speed with which Brazil’s soybean crop has been planted this year. That has some experts forecasting an earlier than usual harvest with Brazil’s January exports around 2.3-2.5 MMT, in contrast to virtually zero in January 2020.
February’s shipments are expected to more than double to 5.6 MMT, 3 million more than last year. Also, the country is on track (watching La Nina, obviously) to have record supplies of close to 5.5 billion bushels in the absence of a weather problem.
The net of all this? The U.S. has lost close to 300 mbu of export business so far this year, which more than likely cannot be made up, and the window to be the major export supplier in the global market appears limited to December and January.
Improved corn outlook
Our take on the export corn market has been improving in recent weeks. Granted, we were disappointed China’s record book at the beginning of the 2021-22 crop year did not immediately translate into actual export loadings (Hurricane Ida not withstanding). Currently, USDA is printing a 2.5 bbu export forecast for corn, keeping that range between 2.4 and 2.5 billion since back in May.
We can further dissect the current numbers but it may be enough to note:
China has about 40 mbu MORE on the books versus a year ago but liftings are barely a third of last year’s pace;
Sales to Unknown are down more than 50%;
Sales to the Mid-East and Other Asia are 20% less this year despite sharply lower exports from Brazil;
The good news is that Mexico has been very aggressive in buying (and importing U.S. corn). Year-to-Date sales are up close to 25% and imports through Mid-November are 36% larger at 141 million.
Canada’s drought this summer has dramatically increased its corn buying with purchase so far this year reaching nearly 75 mbu, a 5-fold increase.
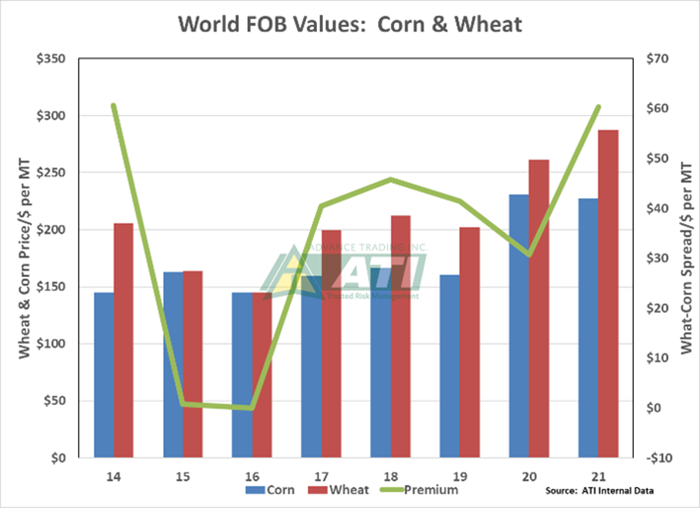
One point that may aid the export outlook in the months ahead is the escalating price of wheat. The two graphs below hopefully give some price insight into the world wheat and corn markets. The first graph compares the lowest price of corn and wheat among the competing exporters since 14-15 ($ per MT, left vertical axis) along with the corresponding wheat-corn spread.


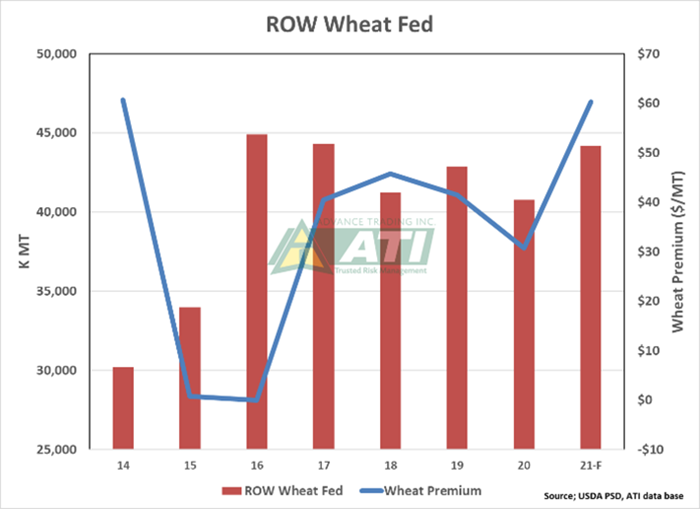
The immediate take-away should be wheat’s current premium to corn is at a 7-year high and very near the $60 average premium realized back in 14-15. So, wheat is getting expensive AND expensive to feed. The 2nd graph, “ROW Wheat Fed” bears a quick explanation—Rest of World stands for all markets other than China AND the major wheat exporters. The graph shows the amount of wheat fed by the ROW countries along with the wheat to corn premium noted above. There’s obviously not a perfect inverse correlation to the wheat-corn spread and ROW wheat feeding, but with the spread doubling so far this year, we question whether USDA’s forecast for a 3 ½ MMT year-to-year increase in ROW wheat feeding is realistic, given where the spread was back in 14-15 when these countries fed 15 MMT (33%) LESS wheat.
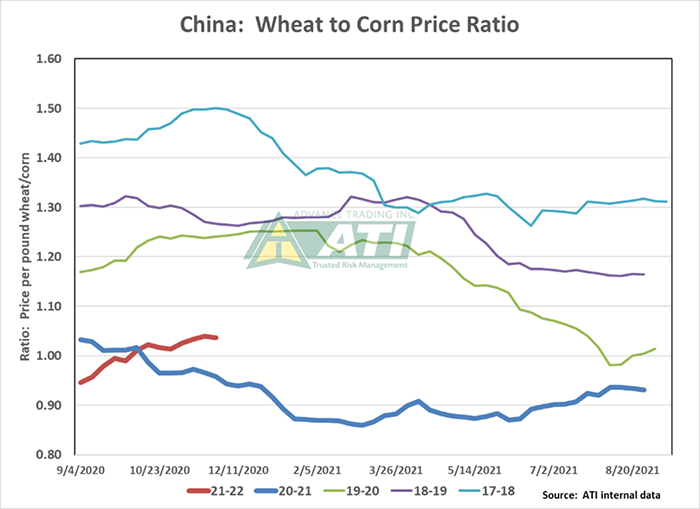
One final point; China fed 40 MMT of wheat in 20-21 as its internal wheat to corn price ratio dropped well below 1:1 on a per pound basis.

That was double the “normal” amount seen in prior years and with wheat prices there on the increase, the USDA attaché is expecting the total to drop back to 36 MMT IN 21-22 with corn rising 11 to 214 million. His take is that since China has a 5 MMT larger beginning stocks total, combined with a 12.3 MMT bigger crop, they will need less outside corn as imports are forecast to fall 3 ½ to 26 million in 21-22.
Summary
There are several unknowns for corn in the export market with world wheat prices seen especially supportive to greater corn feeding. And there’s still the issues of (1) a much larger Ukraine corn crop this year; (2) limited Brazilian exportable supplies until mid-July and (3) La Nina’s impact on the South American crop size. And, of course, the high-priced fertilizer and U.S. producer corn versus soybean acreage decisions later in the spring of 2022.
And belatedly, Happy Thanksgiving from Advance Trading, Inc.!
Contact Advance Trading at (800) 664-2321 or go to www.advance-trading.com.
Information provided may include opinions of the author and is subject to the following disclosures:
The risk of trading futures and options can be substantial. All information, publications, and material used and distributed by Advance Trading Inc. shall be construed as a solicitation. ATI does not maintain an independent research department as defined in CFTC Regulation 1.71. Information obtained from third-party sources is believed to be reliable, but its accuracy is not guaranteed by Advance Trading Inc. Past performance is not necessarily indicative of future results.
The opinions of the author are not necessarily those of Farm Futures or Farm Progress.
About the Author(s)
You May Also Like


