The 2023 corn harvest will likely be remembered for three things. First, yields in many areas that caught timely rains around pollination were good to excellent. Second, in those same areas, corn tended to reach black layer later than normal and dried down in the field slower than expected. Third, the leading explanation by far in elevator truck lines and coffee shops for so much wet corn so late in the season was wildfire smoke that blanketed some areas on several occasions in June and again in late July.
The first two observations are true, notes Bob Nielsen, retired Extension corn specialist with Purdue. However, Nielsen doesn’t believe wildfire smoke was a direct cause of the slow grind to black layer and subsequent delay in grain drydown.
“It may have indirectly played into it if it resulted in some cooler days,” Nielsen says. “But there were plenty of cool days where there wasn’t wildfire smoke.
“The better explanation is that cooler weather in June and again in early to mid-August slowed accumulation of growing degree days, and that slowed corn maturity. The cooler the temperatures, the slower GDDs accumulate. Corn hybrids need a certain level of GDDs to mature.”
Nielsen adds that when corn matures later into the fall, drydown is usually slower. That’s partly because some of the best weather for drying typically occurs in September.
Mapping trends
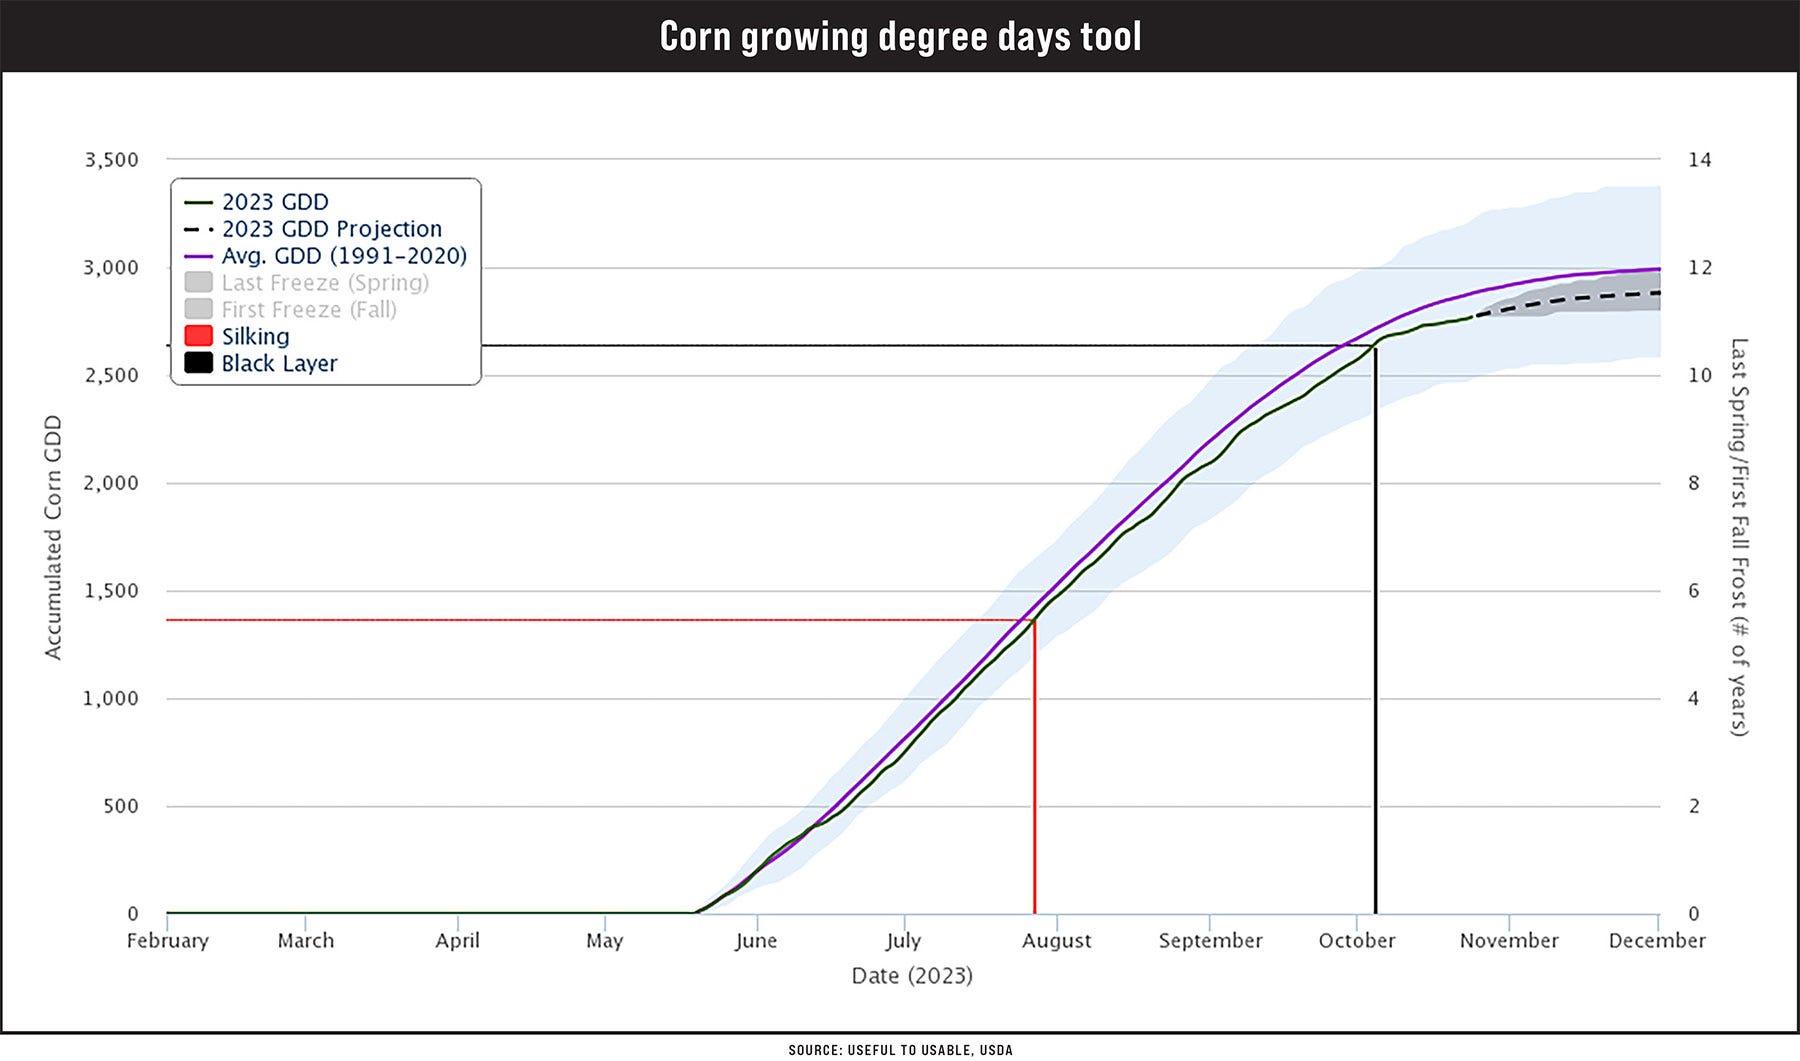
Nielsen turns to the GDD Corn Tool developed by the Useful to Usable USDA-funded project to illustrate how the 2023 season compares to previous years for temperature. The tool allows the user to select from many, though not all, counties in several Midwestern states, and view actual vs. historical temperature data. It is maintained during the growing season.
To create the chart shown below, Nielsen chose Blackford County, Ind., a 109-day hybrid maturity, and a May 19 planting date.
“That represented one of our on-farm sulfur trials where corn was still running about 30% grain moisture at the end of October,” he explains.

The purple line represents normal GDD accumulations for that location, and the black line represents GDD accumulations this year.
“The GDD tool estimated that black layer did not occur until Oct. 4, which was exactly what our cooperator told us happened,” Nielsen says. “More importantly, the chart illustrates the deviation from normal GDD accumulations for this location throughout the season. Cooler temperatures in mid-June put us behind normal early. Then around mid-August, cooler-than-normal temperatures again expanded that deviation further. Continued cooler-than-normal weather since black layer further slowed in-field drying.”
Weather records like this one are useful because they document what happened vs. what you think happened, Nieslen says. “Yes, there was an extremely hot week at the end of August, but GDDs top out at 86 degrees F in the formula,” he says. “One very hot week doesn’t offset several weeks of cooler weather at key times.”
Read more about:
Dry DownAbout the Author(s)
You May Also Like


