USDA’s updated production estimates released Oct. 12 weren’t a huge surprise. Yes, the agency increased its forecast for soybean yields more than expected. And corn yields went up slightly, bucking trade hopes for a cut. But the changes weren’t really exceptional by historical standards.
While bulls looked for the exits, some market participants again voiced frustration with their inability to predict production based on USDA weekly Crop Progress reports released most Mondays during the growing season by the National Agricultural Statistics Service.
Those who think the trading public would be better off without the reports believed they found fuel for their arguments in the past two growing seasons. They focused on condition ratings that show the percentage of crops in each of five categories ranging from very poor to excellent. These scores didn’t match what some traders expected USDA to report for yields, especially the past two growing seasons.
The Crop Progress reports don’t include a projection of yields, of course. But traders make statistical forecasts for yields based on these numbers. Last year, for example, strong early soybean ratings projected yields of 54 to 55 bushels per acre. While ratings slipped by the end of the season, thanks to the derecho winds that flattened crops, the final condition report still translated to a near-record 51.7 bpa yield according to my models.
USDA’s final monthly yield released in January 2021 appeared to be a mis-match at 50.2 bpa – at least until the government raised its estimate at the end of September to 51 bpa, boosting total production 81 million bushels.
Corn’s different trajectory
Estimates for 2020 crop corn followed a different trajectory. As with beans, very hopeful early ratings suggested potential for record yields well above 180 bpa. By harvest ratings were lower, trimming some models to around 175 bpa, but USDA’s January number came in at 172 bpa, which was lowered to 171.4 after Sept. 1 stocks data came out last month.
Last year’s wind disaster was one obvious potential culprit for these discrepancies. This year’s drought over parts of the northern and western Corn Belt may have had a similar effect on corn. Strong early ratings dropped sharply as dry conditions spread out of the Dakotas, with some models based on ratings putting yields below 170 bpa. Weekly rankings improved slightly after bottoming in mid-September, but USDA’s decision to boost its yield Oct. 12 still caught some leaning the other direction.
Soybeans suffered the worst of the damage. The national soybean yield rose nearly a bushel per acre to 51.5 bpa, adding 74 million bushels to new crop supplies already swelled by those revised estimates of 2020 production put out at the end of September. That sent November futures below $12 enroute to the contract’s lowest level since March 31.
December corn, meanwhile, slipped to a one-month bottom after the government nudged yields two-tenths of a bushel higher to 176.5 bpa, increasing production 23 million bushels.
Lance Honig, chief of the crops branch at USDA-NASS that puts out Crop Progress, Production, Grain Stocks and other reports, is familiar with these complaints, which came up once more at the agency’s two-day data users conference held virtually at the end of last week.
Honig cautioned against using the Crop Progress data to project yields and said the same is true for satellite vegetation data, another tool used by USDA and some analysts. Some years this data corresponds closely to yields found in NASS surveys of farmers and their fields. Other years, not so much.
“It doesn’t always match up,” Honig said on the Zoom call. “A lot of times it works really well and sometimes it doesn’t,” he said, noting the reports are based on “what things look like."
“Some years what things look like and what they really are, aren’t always in sync.”
Multiple forecasting methods
This is why I use multiple methods for forecasting yields. In addition to tweaking crop ratings with various formulas, I look at growing season weather and weekly Vegetation Health Index maps for the U.S. and key Midwest states to create an array of potential results. Then, I combine these factors using a multiple regression analysis, which is compared to Farm Futures proprietary survey of growers each August.
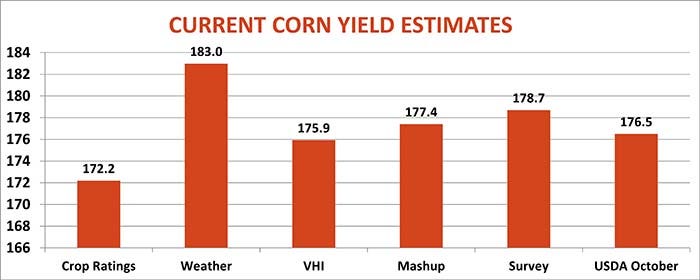
Sometimes these tools agree, and sometimes, as Honig said, they don’t. This year that appears to be true for corn. The weather model projected huge yields – 183 bpa for corn, while our Farm Futures survey called for 178.7. But crop ratings and to a lesser extent, the VHI, called for lower production.
Mashing up all the estimates generates a yield of 177.4 bpa, suggesting USDA’s decision to raise yields in October may not be the final adjustment.
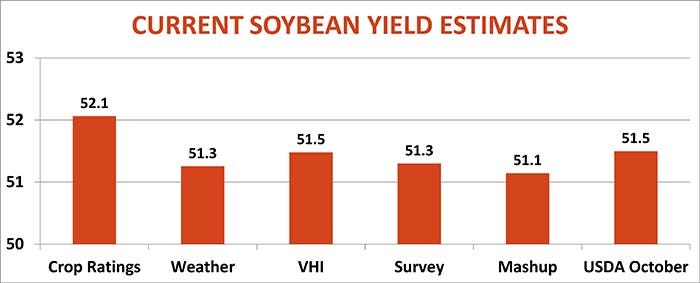
Current soybean yield projections don’t show as much variance. While crop ratings currently put the yield at 52.1 bpa, the other methods are all close to USDA’s October print of 51.5 bpa.
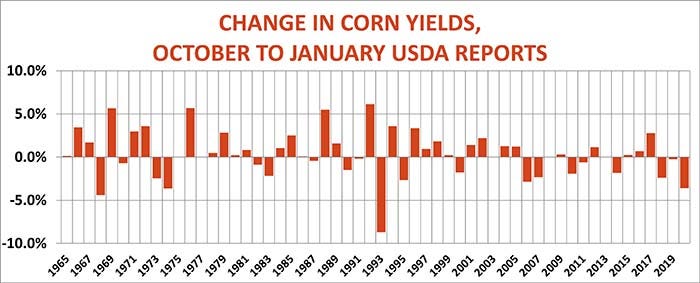
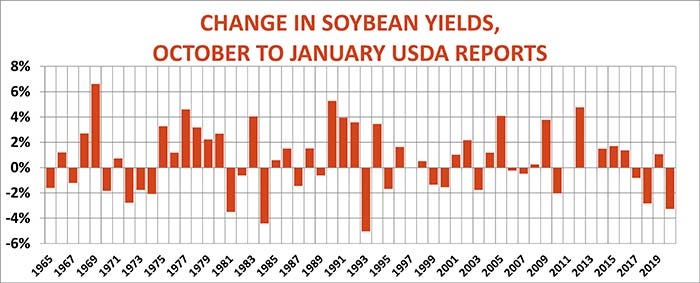
Historically, both corn and soybeans rose 31 times from October to January, around 55% of the time since 1965 – not frequently enough to be statistically significant.
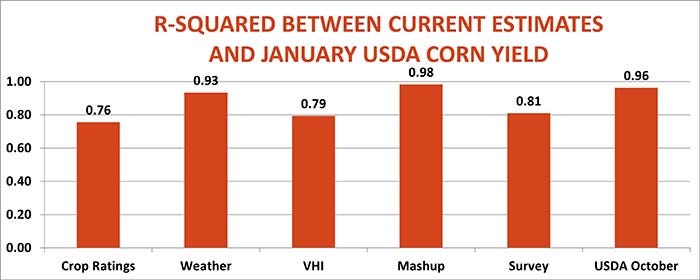
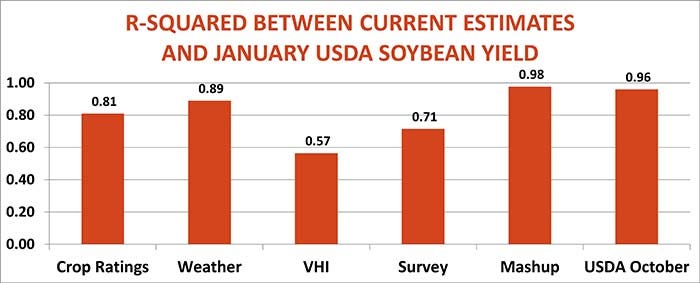
Each method for predicting yields can have its day in the sun, proving most accurate in any given year. A statistical measure known as R-Squared computes the variance between each method and USDA’s annual January gold standard. Weather, the multiple regression mashup and USDA’s own October forecasts are the most accurate indicators. That suggests bulls may be hard-pressed to really good news about supply down the road.
Knowing these tendencies, look for traders to have a bearish bias for supply, putting the onus on demand news and spillover from other markets as market movers.
Knorr writes from Chicago, Ill. Email him at [email protected]
The opinions of the author are not necessarily those of Farm Futures or Farm Progress.
About the Author(s)
You May Also Like


