

Subscribe to receive top agriculture news
Be informed daily with these free e-newsletters

Ag Marketing IQ: Acreage and stocks reports wet appetites for weather markets.

USDA’s end of June reports on grain stocks and acreage are usually just an appetizer for the market’s main event – fireworks after July 4. This year’s twin data releases on inventories and seedings aren’t expected to be more than small plates while traders wait for crucial weather forecasts for July corn pollination.
This year meteorologists are more popular than usual, thanks to dry conditions parching much of the Midwest. Still, USDA will have its say before corn and soybean markets close for what many will be a four-day Independence Day weekend.
Big changes in these June reports are the exception, but they do occur. The granddaddy of these adjustments came in 1983, the year farmers idled millions of acres to participate in in the government’s PIK program, only to watch as corn fields withered when a blast of hot, dry weather baked fields at pollination.
Soybean acres plunged in 2019 as farmers battled wet conditions, while corn plantings fell in the following year after record March intentions and the COVID pandemic crushed prices and hopes for ethanol usage. Then last year soybean seedings fell sharply due to wet fields on the northern Plains.
Grain stocks are normally fairly easy to estimate, but these too can produce surprises. Both reports set the tone for what happens next, giving lift to weather rallies and punishing prices when conditions favor good yields.
Here’s a look at what I see for this Friday’s June 30 report, and more importantly, how weather is impacting crops.
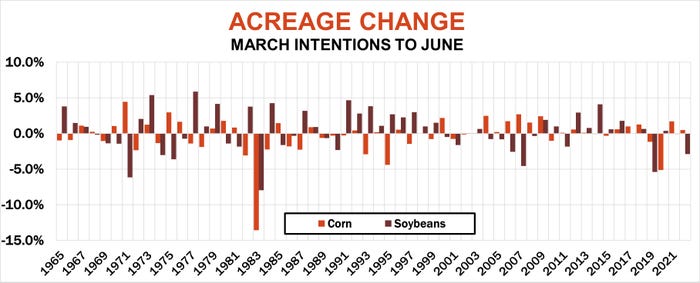
USDA tends to report more acres of both corn and soybeans in June compared to March intentions. Since 1965, June corn plantings were higher 32 years, with soybeans increasing 33 times, a little better than 55%.
Depending on how you crunch the numbers, if June 2023 follows form the total for corn could go up 50,000 to 120,000 acres. Soybean seedings could go either way, from down 125,000 to up 300,000. Big changes don’t seem likely because favorable weather let planters run.
Economics likely favored corn a little. New crop futures for both crops plunged in May. Corn bottomed before soybeans, making corn modestly more attractive for late-planted fields based on the price ratio and profit-per-acre between the two.
USDA’s quarterly Grain Stocks show how much of each crop “disappeared” – econ-talk for usage – during the March-May quarter. Demand from exporters and processors crushing soybeans and making ethanol is fairly well known because data is reported weekly or monthly. Corn feed to livestock is always a guess because this category includes “residual” usage, a factor also used for soybeans to adjust statistical error from report to report.
There should be plenty of corn left over for summer usage – 4.11 billion bushels according to my models, less than last year but more than during the 2020-2021 marketing year. A little more than 900 million bushels of soybeans likely were around on June 1, more than enough to meet expected demand and leave a cushion until harvest starts in the fall – unless 2023 yields plummet.
That, of course, is the big unknown for the markets headed into the holiday, after precipitation in key states during the first three weeks of June fell far short of normal.
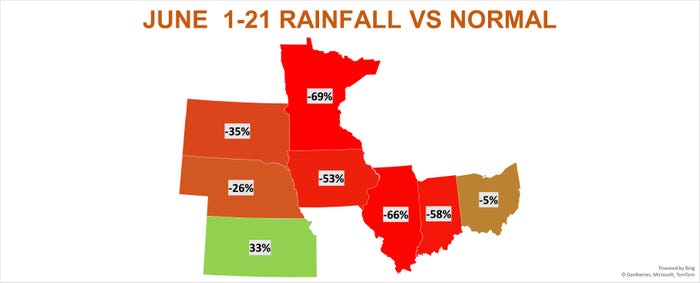
A few states improved rainfall totals over the past two weeks, with Ohio picking up good coverage in the central part of the state. But overall precipitation in eight Midwest states used in a popular corn yield model remained historically dry, particularly the “three I” states. After weighting for expected harvested acreage, June rainfall would be the third driest since 1930 if the current rate lasts though the end of this week.
That may be too big of an if. Current forecasts suggest a shift in weather pattern favoring more moisture, especially in the eastern and northwest part of the Corn Belt. Those forecasts knocked 45 cents off December corn and 85 cents off November soybeans, though both markets remain in uptrends off both May and June lows.
If this June turns out to be in the top 10% driest, the corn model including forecast July weather would drop the U.S. average yield to 173.4 bushels per acre. USDA currently has a 181.5 bpa yield plugged into its price forecasts, based on normal weather.
A dry June could also impact soybean forecasts, knocking the yield down to 49.5 bpa. USDA currently has a normal yield of 52 in its forecasts.
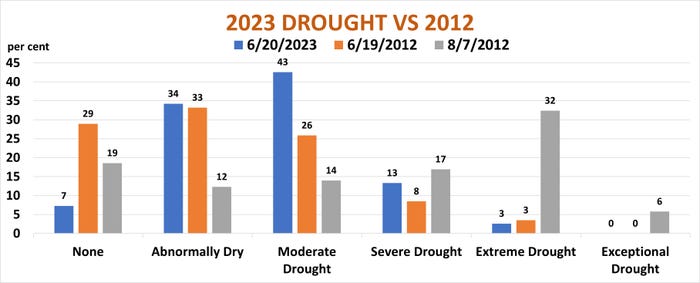
June weather is only one factor, and what happens to temperatures and rainfall in July for corn and July and August for soybeans combine to play a more important role. The last big drought in 2012 demonstrated that clearly.
Last week’s Drought Monitor reported 93% of the Midwest suffering from dry conditions. After three weeks of June in 2012, only 71% of the region was dry.
In both 2012 and 2023, just 3% of the Midwest was in extreme drought. But by the time the 2012 drought peaked in the first week of August, 32% of the region was in extreme drought, and 6% was in an “exceptional drought.” So, much can change.
Daily weather data provides one input to plug into forecasting models. Other tools watched by traders include weekly Crop Progress reports from USDA and the Vegetation Health Index put out by U.S. meteorologists.
The VHI for both corn and soybeans are more than 10% below average for this time of year, These weekly indexes point to corn yields from 161 to 170 bpa with soybeans from 49.8 to 51.4 bpa.
Markets peaked last week after USDA said just 55% of corn and 54% of soybeans were in good or excellent condition. Just what that might mean for yields depends on the time frame used for comparison.
Crops this early in the growing season are normally in much better shape, so making the forecast based on how fields typically look now produces very low yield forecasts – 160 to 165 bpa for corn and 46 to 49 bpa for soybeans.
But if current conditions persist through harvest, yield prospects rise to 170 to 173.4 bpa for corn and 51.3 to 52.4 bpa for soybeans. And if crops improve, USDA’s “normal” yields of 181.5 and 52 bpa – or even better – could be in play.
In the meantime, watch reaction to the June 30 reports. Markets that can’t rally if the news is bullish compared to expectations are ones that could be in trouble.
Knorr writes from Chicago, Ill. Email him at [email protected].
The opinions of the author are not necessarily those of Farm Futures or Farm Progress.
Read more about:
WeatherYou May Also Like
Enter a zip code to see the weather conditions for a different location.


