Global commodity markets have dealt with an awful lot of dynamics over the last month. The Russian invasion of Ukraine helped push energy and agricultural commodities sharply higher to start the month, with trend following and index funds alike plowing money into several markets sensitive to potential disruptions from Black Sea tensions.
It is unclear what exactly has been “priced in” on the global agricultural balance sheet, but one must admit that a $6 rally in Chicago wheat and a $1.70 rally in corn since the start of February have surely priced in an awful lot of disruption. Whether the long-term ramifications of Russia’s invasion end up being as bad as the market feared at the emotional apex will likely be determined in the next 4-6 weeks. The potential for the situation to resolve amicably has been in recent headlines, but like this year’s AFC Championship football game, what appears to be the most likely outcome can change in an instant.
In the midst of chaos and ever-changing sentiment, a few considerations may help us understand the intentions of fund managers over the next several months before we get into our own domestic weather market.
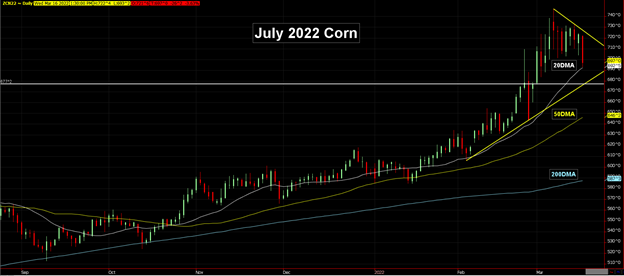
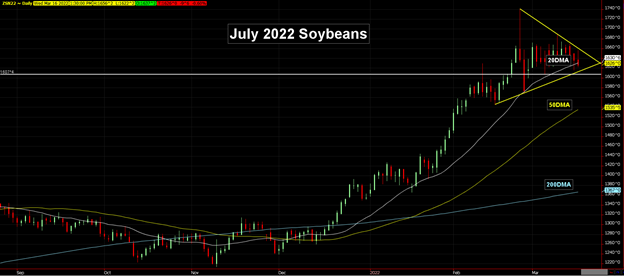
Considering most of you reading this are inherently long corn and soybeans, I wanted to illustrate the technical conditions to watch that could lead to a liquidation event.
July Corn and soybeans are still in an up-trend and have yet to break support, but we need to be aware of potential conditions that will warrant aggressive fund selling.
Since the beginning of February, the 20-Day Moving Average, labeled in white on the chart, has been a strong stopper of pullbacks for both corn and soybeans. July corn has not closed below the 20DMA since Jan. 18, while July soybeans have not closed below its 20DMA since Dec. 13. Both July corn and soybean contracts are currently interacting with their respective 20DMAs. Closing below their respective 20DMAs could cause further selling and lead to a retest of the month’s lows.

Up-trends from February lows are still holding, but if corn and soybeans manage to make new lows for the month, those trend lines will be breached. The low for the month of March, thus far, on July corn is 677’2 while it sits at 1607’4 on July soybeans. Both corn and soybeans have about 20 cents of distance between current values and the lows of the month. Closing into new lows for the month and breaching their up-trend lines could cause further liquidation and lead to a retest of lows made Feb. 25, the day after Russia invaded Ukraine. You might recall corn was limit down for a part of that session, a day removed from trading limit up on the invasion.
Those lows made on Feb. 25 for both corn and soybeans also have the 50DMA, labeled in yellow on the chart, residing at the same levels. If the ball is rolling downhill and the lows from Feb. 25 give way, another major moving average will also be breached simultaneously which would likely exacerbate the selling.

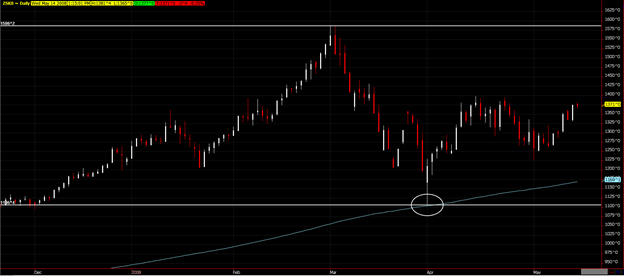
Crude oil is roughly 27% off the recent high made at $130/barrel. What would it look like if corn and soybeans had a similar percentage correction? March corn hit a high of $8.00 before expiration. If a 27% correction was in order, that would suggest a move to $5.84, while the 200DMA, labeled in blue on the chart, is $5.87. This would likely be a worst-case scenario type move that would completely reset values to the same moving average that held the fall lows in corn in both September and October. If you read my blog last month, I looked at 2008 for comparison and as a reminder of what can happen if liquidation becomes the theme of the market. The $4.80 break that occurred stopped right on the 200DMA, which is shown on the chart below.

Like I mentioned earlier, both markets are still trending higher and holding support, but if things were to snowball into a down-trend for whatever reason, this is how I would see that move evolving. If you want assistance in protecting the value of your crop, as always, feel free to contact me directly at 815-665-0463 or anyone on the AgMarket.Net team at 844-4AGMRKT. We are here to help.
Reach Brian Splitt at 847-946-2080 or [email protected].
The risk of loss in trading futures and/or options is substantial and each investor and/or trader must consider whether this is a suitable investment. AgMarket.Net is the Farm Division of John Stewart and Associates (JSA) based out of St Joe, MO and all futures and options trades are cleared through ADMIS in Chicago IL. This material has been prepared by an agent of JSA or a third party and is, or is in the nature of, a solicitation. By accepting this communication, you agree that you are an experienced user of the futures markets, capable of making independent trading decisions, and agree that you are not, and will not, rely solely on this communication in making trading decisions. Past performance, whether actual or indicated by simulated historical tests of strategies, is not indicative of future results. Trading information and advice is based on information taken from 3rd party sources that are believed to be reliable. We do not guarantee that such information is accurate or complete and it should not be relied upon as such. Trading advice reflects our good faith judgment at a specific time and is subject to change without notice. There is no guarantee that the advice we give will result in profitable trades. The services provided by JSA may not be available in all jurisdictions. It is possible that the country in which you are a resident prohibits us from opening and maintaining an account for you.
About the Author(s)
You May Also Like


