On Aug. 12 USDA surprised the market with its below normal corn and soybean yield projections. But rally attempts quickly failed, triggering a flood of second-guessing about the accuracy of the estimates.
It takes plenty of opinions to make a market, of course, and the debate over the size of 2021 crops won’t be settled soon. History suggests it could be several months or more before price trends will really be known.
For one thing, production is only part of the equation. Demand prospects must also be confirmed, a process that takes time.
For the record, USDA put corn yield at 174.6 bushels per acre, with soybeans pegged at 50 bpa. Adding to the uncertainty: The government’s August estimates were based on farmer surveys. Enumerators will gather samples from fields for the first time this year when work begins this week on the updated estimates due Sept. 10.
Production guesses are pegged to the first of the month, so how have conditions changed since Aug. 1?
Monday’s Crop Progress report put the percentage of the corn crop rated good or excellent at 60%, a 2% drop from the 62% reported for Aug. 1. Soybeans came in at 56% G/E, compared to the 60% at the start of the month.
Those are national averages. State-by-state conditions, which I weight differently, point to a U.S. yield of 168.4 bpa for corn, down near 4 bpa from the Aug. 1 reading of 172.3, with soybeans at 50.1 bpa, down from 51 bpa.
But not all barometers agreed. Projections made using Vegetation Health Index satellite data moved higher this week, taking estimated corn yields to 175.7 bpa, up 1.7 bpa from Aug. 1. Soybeans rose 0.3 bpa to 51.5.
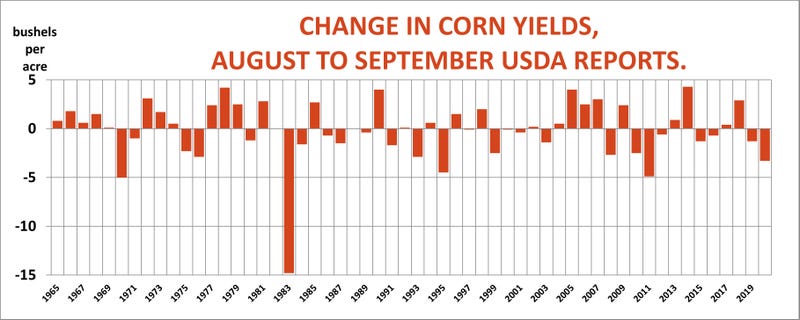
With corn and soybean futures struggling, traders appear to be bracing for an increase in both crops’ yields in the Sept. 10 update from USDA. Historically speaking, changes from August are the rule, not the exception. Government statisticians kept their August estimates unchanged only twice dating back all the way to 1965. Corn yields went up 28 years and down 26 years, with most of the changes in a band from five bushels per acre either side on the August estimate.
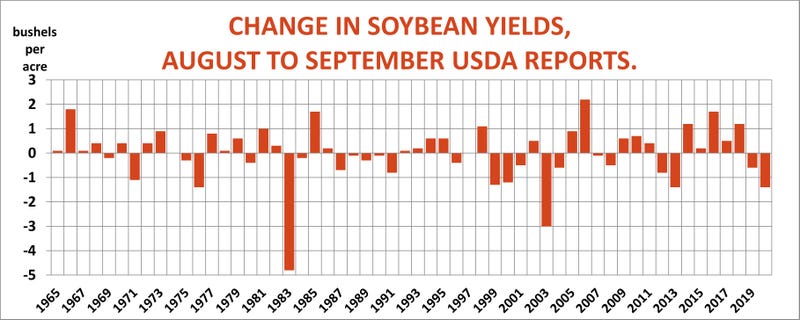
Soybean yields showed a slightly greater propensity for increases, going up 30 times and down 24, with yields typically changing two bushels or less either way.
There’s a modest correlation between changes in ratings and changes from USDA in September. But since ratings usually drop in August as the crop matures, this measurement suggests smaller yield losses. The current changes suggest corn ratings could be a half bushel lower in September, with soybeans easing a third of a bushel per acre.
Another source of uncertainty: Ideas USDA may ultimately up its estimate of corn plantings, based on acreage farmers certified to the Farm Service Agency. Add in doubts about export demand after record-setting sales of 2020 crops, and it’s little wonder futures have struggled. After all, that’s the pattern for corn and soybeans even in bullish years.
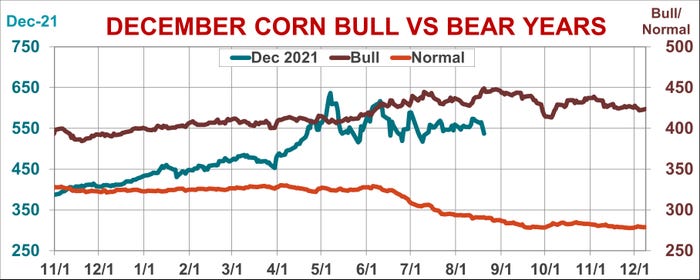
The seasonal chart for December corn shows futures peaking in bullish years shortly after the August USDA numbers come out, with prices tailing off into delivery. This year December peaked earlier, in May, about the time the market tops in years of normal production. However, unlike the normal-year average, futures continue to hold above spring lows.
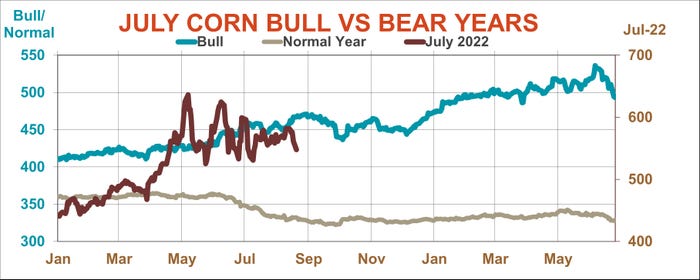
July futures trends can also offer clues, because sometimes bullishness isn’t confirmed until USDA puts out its final production estimates in January. The July seasonal shows futures on average trading in a consolidation range from the August report until the end of the year. July went up 46% of the time from August into January, and down 54%, but the average change was only 2.5 cents.
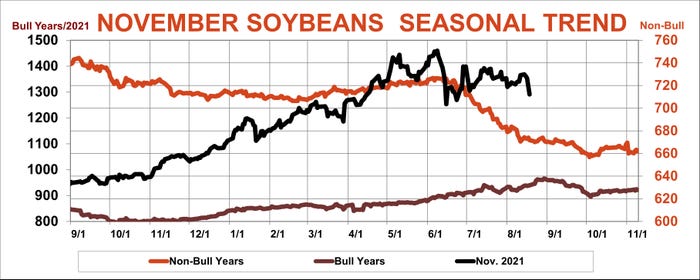
Patterns for soybeans are similar, with a few tweaks. November futures on average in bullish years tend to top up in early September, as USDA gathers samples for that month’s production estimates. The soybean crop is made in August, a likely explanation for the delay.
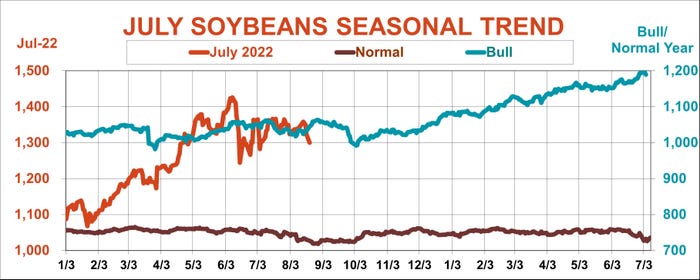
In bullish years, July soybeans for delivery the following summer don’t take out summer highs until traders get serious about the January USDA reports. But even with harvest pressure, average prices stay above spring lows, keeping the uptrend in place. In years of normal production futures make new lows ahead of the September reports. But the overall pattern on average is sideways, with July higher 52% of the time into January, and down 48%.
All these patterns suggest traders looking for a clear trend to trade as crops mature will likely be disappointed until 2021 crops are safely tucked away in storage and more is known about demand.
Of course, averages are just that, concealing a few big moves, both up and down during the fall. July 2021 futures gained more than $4 a bushel from August into January. But July 2009 beans lost nearly $5 after commodities collapsed along with other markets during the 2008 financial crisis.
Such surprises don’t come often, but increase the difficulty of plotting storage strategies for growers.
About the Author(s)
You May Also Like


