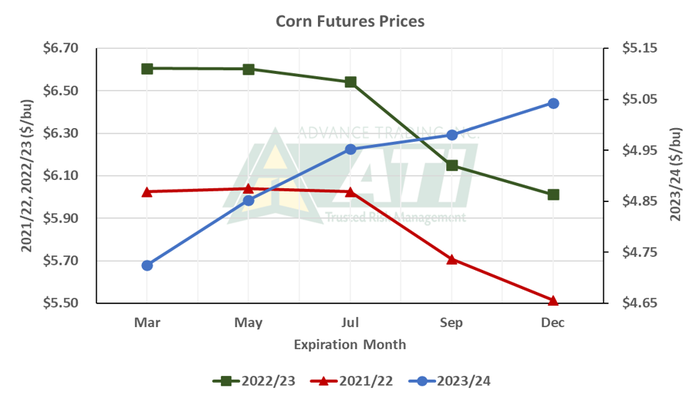
Futures prices offered for 2024 delivery are not guaranteed to be at today’s level as the crop year proceeds. However, market erosion is possible if no major supply or demand surprises arise. To manage the market, monitor market carry and utilize a variety of risk management tools to “lock in” the current market carry, while also providing flexibility to participate if a price rally develops.

Monitor the cost of market carry
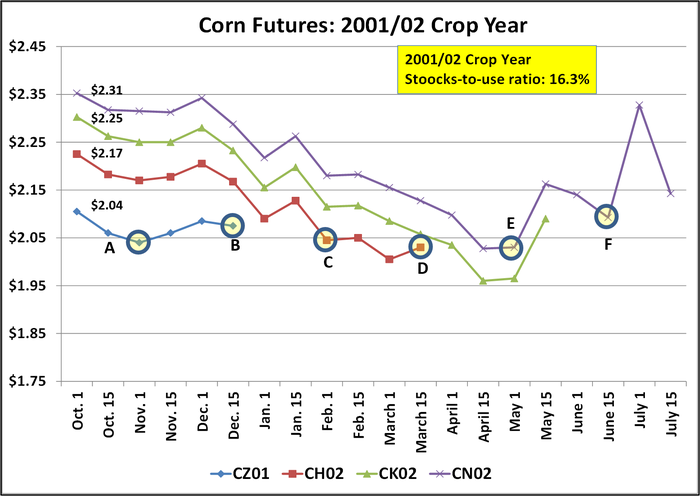
The premium of deferred corn futures contracts, or market carry, is higher this year compared to recent years. What’s extremely important to note, however, is that the futures prices offered for 2024 delivery are not guaranteed to be at today’s level later in the crop year. The best way to illustrate this is with the example in the graph below.
On Nov. 1, 2001, the December 2001 corn contract closed at $2.04 (point A on chart below). By Feb. 1, the March 2002 contract was also at $2.04 (point C), although that was $0.13 lower compared to where it was on Nov. 1.
Note how the May and July contracts also generally eroded during the crop year (points C, D, E and F); e.g., on May 1 (point “E”), July futures were at $2.03 to $0.28 below where the contract was on Nov. 1.
Even though the market eventually rallied, July futures by expiration were still $0.17 below the Nov. 1 price. In the absence of a major surprise in supply or demand, this gradual erosion in price has often happened in a crop year characterized by large market carry.

An important point is the U.S. corn stocks-to-use ratio for 2001/02 was 16.3%. By comparison, the U.S. corn stocks-to-use ratios for the past three crop years – 2020/21, 2021/22 and 2022/23 – were 8.3%, 9.2% and 9.9%, respectively. Utilizing data from the USDA Supply/Demand report earlier this month, the projected stocks-to-use ratio for 2023/24 is 14.7%. This is much closer to what was seen in 2001/02 compared to each of the past three years.
It’s impossible to say at this point if this pattern of gradual price erosion will occur in 2023/24. A variety of risk management tools can be utilized to lock in the current market carry, however, while also providing the flexibility to participate if a price rally develops. It is prudent with harvest complete to consult with your advisor to identify which strategy is the best fit for your operation.
Contact Advance Trading at (800) 747-9021 or go to www.advance-trading.com.
Information provided may include opinions of the author and is subject to the following disclosures:
The risk of trading futures and options can be substantial. All information, publications, and material used and distributed by Advance Trading Inc. shall be construed as a solicitation. ATI does not maintain an independent research department as defined in CFTC Regulation 1.71. Information obtained from third-party sources is believed to be reliable, but its accuracy is not guaranteed by Advance Trading Inc. Past performance is not necessarily indicative of future results.
The opinions of the author are not necessarily those of Farm Futures or Farm Progress.
About the Author(s)
You May Also Like


