Back in mid-February, the USDA conducted its 100th annual Agricultural Outlook Forum which gave the market its initial, official government take on the prospective outlook for corn, soybeans, wheat and other major agricultural products. Our goal here is to summarize some of the immediate takeaways for corn and soybeans.
To cut to the bottom line, USDA economists expect ending 2024-25 corn stocks to rise by 360 million bushels or over 16% to 2.53 billion. With a modest 1%/150 mbu expansion in demand, the closely watched stocks-to-use ratio is estimated at 17.2%, up from 14.9% this year.
The last time the stocks-to-use ratio was that high was at the end of the 2005-06 crop year when the ratio reached 17.4%. Carryout was 1.97 billion and producer prices averaged a not-so-profitable $2 per bushel. It is a trifle bearish, but USDA predicts producer prices will only fall from the 2023-24 March estimate of $4.75 to $4.40 in 2024-25.
For soybeans, carryout is forecast to increase by 120 mbu to 435 mbu. Consumption is predicted to grow 6% to 4.4 billion. Projections show 100 million will come from increased crush due to the expected rise in soybean oil used for the production of biofuels as well as expanded soybean meal consumption for both domestic and export markets. The stocks-to-use ratio for 2024-25 is likely to rise from 7.6% this year to 9.9%.
While not as burdensome as corn, the ratio is still well below the average levels of at least 15% for the 2017-18 and 2019-20 crop years.
Producers, according to the USDA, can expect to realize $1.45 less per bushel as the expanded stocks cushion pressures prices from 2019-20’s $12.65 per bushel level to $11.20 in the upcoming crop year. Somewhat interesting perhaps is that while the level of corn stocks is becoming rather burdensome, particularly relative to soybeans, the USDA expects a smaller decline in corn prices ($0.35 or 7%) when compared to the fall in bean prices ($1.45 or 12% per bushel).
Included in the USDA’s projections are a 3.6 million acre decline in corn area planted to 91.0 million acres with soybeans forecast to rise nearly 4 million acres to 87.5 million acres. Acreage numbers at the 2023 Forum had corn at 92.0 and soybeans at an unchanged 87.5.
The higher soybean number this year may in part be explained by the bean-corn ratio which stood at 2.47:1 as of Feb. 1 of this year, up from 2.28:1 a year earlier. Producers have seen the nearby SK/CK ratio appreciate considerably since back in July, rising from around 2.10 to 2.71 currently and putting soybean profitability in a much more favorable light.
Key assumptions for corn
2024-25 corn production is forecast to decline 300 mbu to 15.04 bbu as producers plant and harvest 3.6/3.4 million fewer acres but benefit from a nearly 4 bushels per acre increase in trend yield to 181 bpa. This seems a little optimistic given the apparent plateauing in recent years; we think 178 bpa is a more realistic assumption.
Domestic use is expected to rise by 100 million bushels in 2024-25 with feed/residual contributing 75 mbu of that increase and ethanol the remaining 25 mbu. No issue here with the former forecast but we do think the ethanol assumption could be on the light side due mostly to strong export demand.
The export demand category is expected to rise by a fairly modest 50 mbu to 2.15 bbu in 2024-25. Although Brazil’s safrinha crop is not made yet and production estimates there have been shrinking, it would seem unlikely that output could fall enough to offset what is very likely a 20 mmt/near-800 mbu increase to the Argentine crop. This will, in turn, likely force an additional 650+ mbu of exports into the world market and compensate for current ideas of a rather minute 100 mbu year-to-year drop in Brazil shipments, if the USDA is correct.
Mexico and China are two very important demand factors for 2024-25 along with the Black Sea situation and what Ukrainian producers will do with their production decisions; all of which are yet to be determined.
Corn price implications
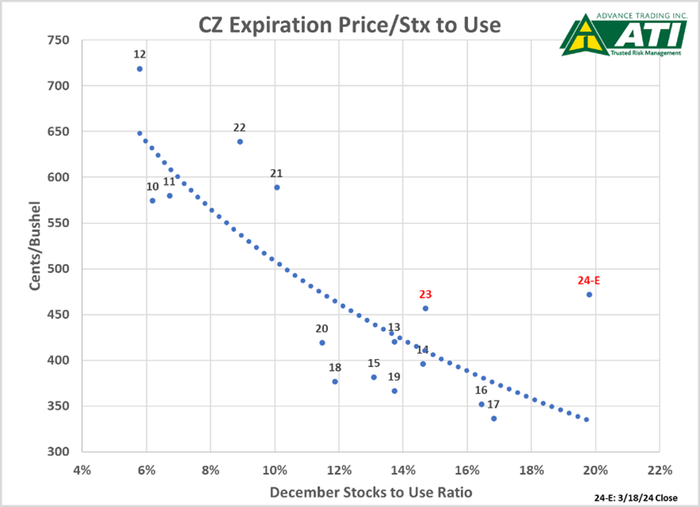
The graph below plots historical expiration December Corn (CZ) prices on the horizontal axis with the corresponding December Supply and Demand Report Stocks-to-Use estimate. For ‘24-‘25, we used the Outlook Forum’s 17.2% stocks-to-use forecast against the current CZ2024 futures price. Generally, there is a pretty good “fit”—a larger stocks cushion means lower prices and secondly, it would seem the market is currently pricing corn well above the “trend line”, more so than in years past. Certainly, there is some degree of a weather premium in place, but should acreage and yield come in reasonably close to the USDA’s forecast, it would appear that there is considerable downside in corn.

Soybean price implications
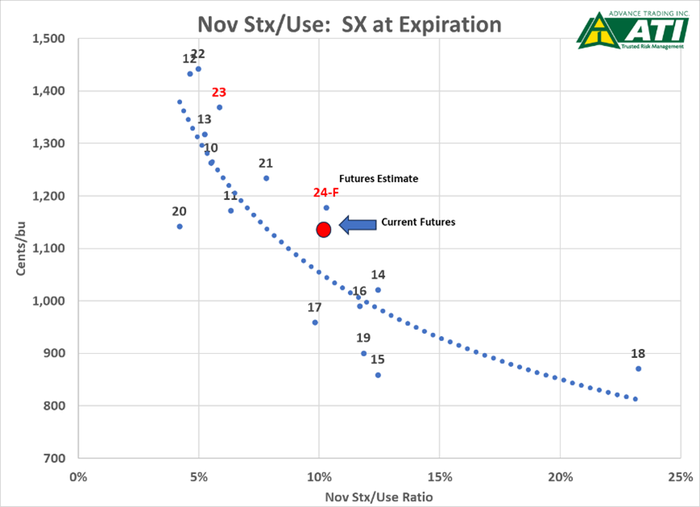
For soybeans, we show a similar chart but to save space and omit the discussion on the possible price drivers. The soybean chart shows the November WASDE stocks-to-use ratio versus the expiration price of the November contract (SX). For the 2024-25 crop, the graph indicates the current SX24 price along with our estimate of where the futures should be at expiration.
The graph suggests that, unlike corn, soybeans seems to have considerably less downside risk due to a variety of factors, which may include:
the effects of emerging biofuels demand
the seemingly greater year to year volatility in South American soybean production
the fact the market is likely very aware that in the past 19 years, the USDA’s final soybean stocks figure has been below the Forum forecast 15 years or almost 80% of the time.
So, less downside risk in soybeans and more in corn. Regardless, consult with your risk management adviser for the best possible strategy for your situation.

Contact Advance Trading at (800) 747-9021 or go to www.advance-trading.com.
Information provided may include opinions of the author and is subject to the following disclosures:
The risk of trading futures and options can be substantial. All information, publications, and material used and distributed by Advance Trading Inc. shall be construed as a solicitation. ATI does not maintain an independent research department as defined in CFTC Regulation 1.71. Information obtained from third-party sources is believed to be reliable, but its accuracy is not guaranteed by Advance Trading Inc. Past performance is not necessarily indicative of future results.
The opinions of the author are not necessarily those of Farm Futures or Farm Progress.
Read more about:
WeatherAbout the Author(s)
You May Also Like


