Debate over the size of 2021 crops has focused mostly on yields as summer officially comes to an end this week, for two very good reasons.
First, yields are the biggest unknown about corn and soybean production after widely variable estimates from USDA, crop models and tours around the Midwest. How many bushels per acre farmers will average also is an easy-to-understand number.
Production has another factor, of course. Yield times acreage is the full equation, but the second part of the formula is much harder to gauge. USDA surveyed growers for seedings in June, but the data published at the end of that month typically doesn’t change until October unless very unusual conditions convince the agency to resurvey growers sooner to get a more accurate count. Then annual estimates come out in January.
June estimates from the government surprised the trade, even though they were significantly higher than 2020. Conventional wisdom believed record profits would convince farmers to boost plantings a million or more from the official June figures. If that belief turns out to be correct, it could add 200 million bushels to the size of the corn crop, and 50 million bushels to soybean supply, one driver behind the market’s inability to rally despite crop struggling ratings.
Prospects for increased acreage got a boost Aug. 12, though the official estimates didn’t change. The same day, USDA’s National Agricultural Statistics Service put yields at 174.6 bpa for corn and 50 bpa for soybeans. USDA’s Farm Service Agency released the first tally of acreage reported by farmers participating in government programs. And it’s those numbers that raised acreage eyebrows.
Comparing acreage estimates
The charts below show how the estimates compare. While NASS estimates go back to 1965 (blue lines), FSA (orange lines) only began releasing monthly data in 2011 after first publishing annual statistics back to 2007. I’ve added another measurement: Acreage farmers enrolled in Risk Management Agency crop insurance programs (green line).
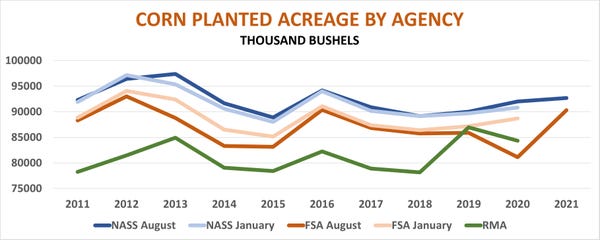
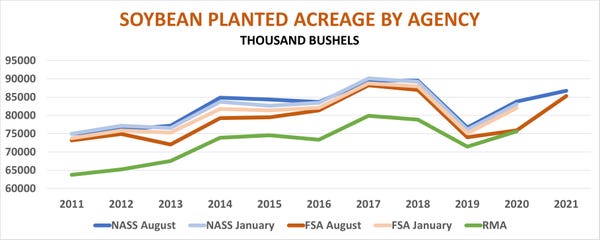
The lines generally follow the same trends, but don’t match for a couple of reasons. One is the nature of the numbers. NASS makes acreage estimates based mostly on surveys from a sample of the total population of farmers. But the FSA and RMA data aren’t an estimate – it’s the totals actually reported.
The lines also don’t match because of when the data is collected and what farms it includes.
The FSA acreage and RMA totals are always lower than NASS’s official estimates. Not all farmers participate in government programs or buy subsidized insurance. And, data tends to trickle into government databases. Some farmers report after the July 15 FSA deadline, and local offices don’t all report at the same time. New programs or changes to existing ones or computer systems can cause delays in FSA’s monthly totals.
Moreover, what counts as corn isn’t the same for each agency. NASS doesn’t include “fresh” corn, which it put at 402,000 acres in 2020. FSA in August broke out fresh and processed corn for the first time, with the total at 351,000 acres. RMA also has separate reporting for sweet corn. Those were 223,831 acres so far.
Another outlier: RMA corn acreage reported in 2019 was higher than the FSA reported in August because farmers flocked to crop insurance after the “bomb cyclone” disrupted planting.
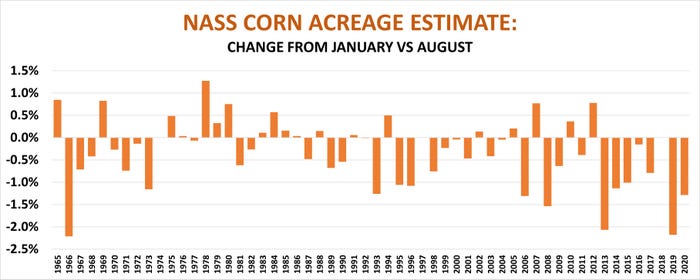
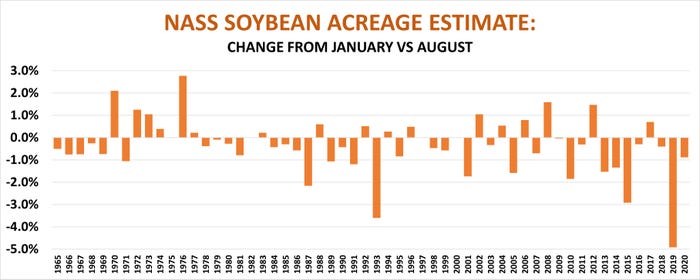
But while FSA totals always increase from August to January, reductions in NASS acreage are the rule, not the exception. Since 1965, soybean acreage decreased from early estimates almost twice as often as it went down, with average reduction of .4% from June until the final monthly estimate in January. The agency reduced its corn acreage estimates 61% of the time, with an average reduction of .5%.
2021 corn and soybean acreage
So, what do these methods suggest about corn and soybean acreage changes this year based on what we know from the three agencies already?
If corn follows the long-term correlation between August and January estimates, acreage could drop 472,000 from the 92.7 million NASS reported in June. If the RMA trend prevails, acreage could go up 742,000 while the FSA pattern would add 1.437 million.
For soybeans, the NASS pattern projects January acreage down 486,000 from the 86.7 million found in June. The RMA trend would add 2.6 million and the projection from FSA August up 1.1 million.
These estimates are for planted acreage – which RMA and FSA only report -- but fluctuations in harvested ground would follow a similar trajectory.
Another wrinkle: The January estimates from NASS can be revised at the end of the marketing year and after the Ag Census done every five years.
Those changes, however, will come long after the fate of prices is decided for 2021 crops. Whatever USDA reports for yields in the months ahead, the acreage question could linger in the minds of both bulls and bears.
Knorr writes from Chicago, Ill. Email him at [email protected]
The opinions of the author are not necessarily those of Farm Futures or Farm Progress.
About the Author(s)
You May Also Like


