Subscribe to receive top agriculture news
Be informed daily with these free e-newsletters

June 13, 2012
The Farm Bill passed by the Senate Agriculture Committee has commodity program payments tied to risk management through such programs as Agricultural Risk Coverage (ARC) and cotton STAX. This emphasis differs from the 2008 Farm Bill where most commodity title payments are direct payments. The emphasis shift from direct payments to risk management changes the mix in spending across crops. Wheat, cotton, rice, and peanuts have larger proportional spending reductions than corn and soybeans. Given a risk management focus, it will be difficult to avoid having some crops taking larger spending reductions.
CBO spending estimates
The Congressional Budget Office (CBO) has estimated Federal spending under 1) the 2008 Farm Bill and 2) the 2012 Farm Bill draft passed by the Senate Agriculture Committee. Average yearly spending from 2014 through 2022 for the 2008 Farm Bill is $5,709 million per year, with 87% of the spending related to direct payments (see Table 1). The remaining spending is for counter-cyclical, ACRE, and marketing loan payments. Not included is spending on crop insurance.
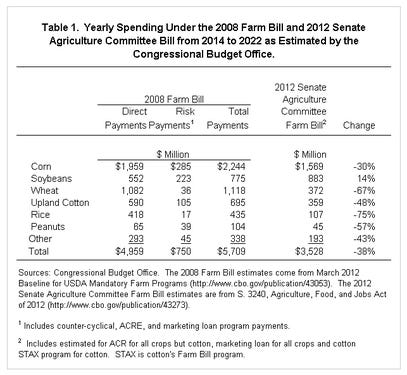 Estimated spending on the 2012 Senate Agriculture Committee bill is $3,528 million per year, which includes spending on ARC, marketing loans, and cotton STAX programs. Proposed spending on the 2012 Farm Bill is 38% less than under the 2008 Farm Bill. Reductions occur because political conditions lead to a spending reduction in baseline agricultural spending. Moreover, there is a movement away from direct payments because direct incomes supports are politically difficult to justify without those payments tied to losses.
Not all crops share equally in the 38% decline (see Table 1). Soybeans has a 14% increase in spending while corn has a 30% decrease. Wheat, cotton, rice, and peanuts have larger decreases than corn. Wheat has a 67% decrease, cotton a 48% decrease, rice a 75% decrease, and peanuts a 57% decrease.
Direct payments, base acres and planted acres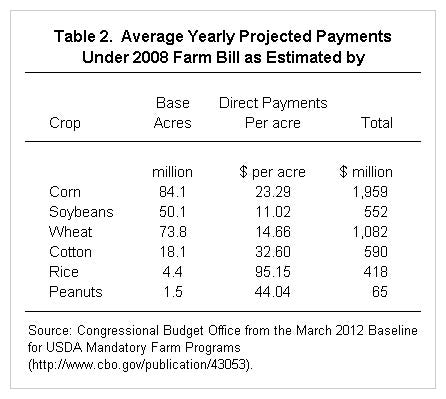 Differences in spending cuts across crops relate to the elimination of direct payment program. Direct payments are fixed yearly payments on fixed base acres. For example, direct payments related to corn total $1,959 million per year. This $1,959 million is paid on 84.1 million base acres at an average payment rate of $23.29 per acre (see Table 2). Relative changes in spending under the 2008 and 2012 Farm Bills relate to 1) changes in base and planted acres and 2) narrowing of per acre payments across crops.
Base and planted acres: Direct payments are made on base acres. Base acres relate to historical production and do not change as planted acres change. On the other hand, ARC and other programs in the 2012 Farm Bill make payments on planted acres, up to acre limits based on plantings in recent years. Crops that have lost acres over time and now have lower planted acres than base acres will lose more under the 2012 Farm Bill and vice versa.
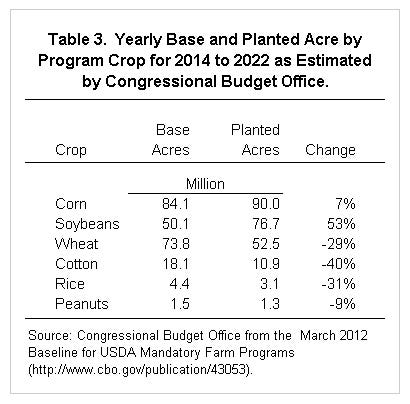 Corn and soybeans have higher planted acres than base acres. For corn, base acres are 84.1 million and planted acres are 90.0 million (see Table 3). Planted acres for corn are 7% higher than base acres. Planted acres for soybeans are 53% higher than base acres, causing the increase in projected spending for soybeans in the 2012 Farm Bill. The remaining crops have decreases in planted acres compared to base acres: a 40% decrease for cotton, a 31% decreases for rice, and a 9% decrease for peanuts. The crops with decreasing planted acres have proportionately larger decreases in projected spending under the 2012 Farm Bill.
Direct Payments per Acre and 2012 Farm Bill Payments per Acre: Per acre direct payments range considerably across the six program crops shown in the previous tables. Soybeans have the lowest per acre rate of $11.02 per acre while rice has the highest payment of $95.15 per acre (see Table 4). From the highest to lowest, the range in direct payments per base acre is $84.10 per base acre ($95.15 payment for rice minus $11.02 payment for soybeans).
The 2012 Farm Bill results in a smaller per acre range across crops. Wheat has the lowest estimated payment of $7.08 per acre. Rice again has the highest payment of $35.08 per acre. The 2012 Farm Bill range is $28.00 per acre. The $28.00 range for the 2012 Farm Bill compares to $84.10 per acre range for direct payments.
2012 Per Acre Spending: The narrowing of the per acre payment range is more pronounced when viewed from the perspective of either gross revenue or total costs. On a percent of projected crop revenue basis, projected 2012 spending as a percent of revenue is 2.1% for corn, 2.3% for soybeans, 2.5% for wheat, 5.4% for cotton, 3.5% for rice, and 3.7% for peanuts.
These projections suggest that these programs will make payments on all crops. While the source of risk may vary across crops, the relatively tight range suggests that all crops face the same magnitude of risks relative to gross revenue.
Summary and commentary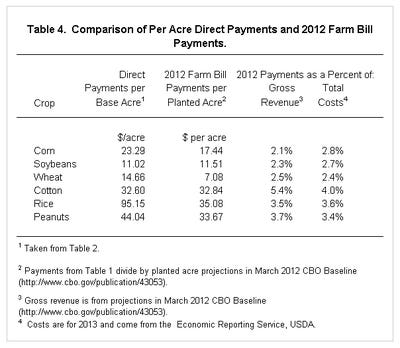 Moving away from base acres will cause wheat, cotton, rice, and peanuts to have higher proportional losses than corn and soybeans. In some respects this should be expected. As a crop loses acres over time to other crops, one would expect its share of commodity program payments to decrease. When acres are changing, evaluating spending changes at a crop level has limitations.
It will be difficult to have a Farm Bill with a risk management focus to maintain the historical proportion of payments across crops. Since wheat has a 39% decline in planted relative to base acres, cotton a 40% decline, and rice a 31% decline, these three crops would have to have much higher projected payments per acre than corn or soybeans to keep historic shares. This would likely result in wheat, cotton, and rice having more risk protection than the other crops. Having difference in risk protection could then have unintended impacts on planting decisions in the future.
Elimination of direct payments and a move to a risk management program will cause financial adjustments for producers with large per acre payments. In particular, rice producers with near $100 per acre direct payments will have adjustments. These direct payments likely have become built into farmland rents and prices. Hence, loss of these payments likely will lead to adjustments in land markets, which will not occur instantaneously, but will occur with lagged relationships over time. Dealing with this issue presents policy challenges.
You May Also Like
Enter a zip code to see the weather conditions for a different location.


