November 5, 2020

A mathematician, a statistician, and an ag economist interviewed for a job. There was one question; “What is 2 + 2? The mathematician said, “4.” The statistician said, “It has a sum of 4, an average of 2, and a variance of 0.” The ag economist said, “What do you want it to be?”
When a wheat price of $5 is based on U.S. hard red winter (HRW) wheat stocks compared to the price relationship to a historical average, $5 may be considered below average. When $5 is compared to world wheat stocks and prices, $5 may be considered a high price.
To understand what a price means to the market, historical prices and the current supply and demand conditions must be reviewed.
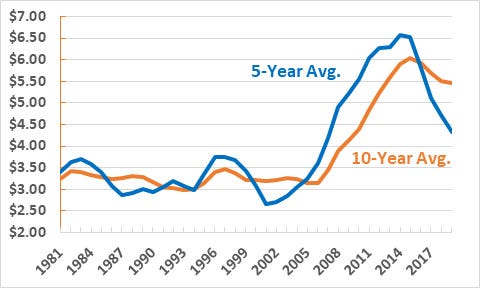
Oklahoma average annual wheat prices may be seen by charting the 5-year and 10-year average prices (Figure 1).
Figure 1. Oklahoma 5-year and 10-year average annual prices: 1981 - 2019

Between 1981 and 2007, the 5-year Oklahoma average annual price range was between $2.67 (2001) and $3.74 (1996 and 1997). The 10-year Oklahoma average annual price range was between $2.99 (2003) and $3.74 (1997). The average price was $3.23.
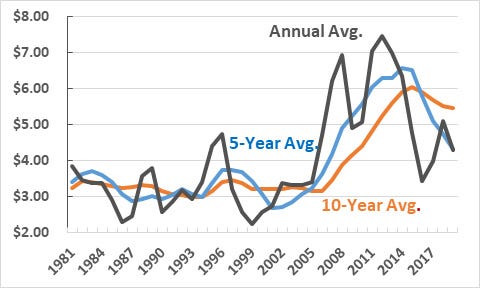
The ethanol in gasoline mandate was passed in 2005 and set at 36 billion gallons in 2007. One result was higher grain prices. In 2005, the 5-year average price line went above the 10-year average price line indicating an upward price trend that peaked in 2012 (Figure 2).
Figure 1. Oklahoma 5-year and 10-year average annual prices: 1981 - 2019

After the ethanol mandate, the next major factors impacting wheat prices were Black Sea region (Russia and Ukraine) wheat production and exports. Russian and Ukrainian wheat production increased from 2.3 billion bushels in 2008 to 4.1 billion bushels in 2018. Wheat exports increased from 204 million bushels in 2010 to 2.2 billion bushels in 2017.
The impact of Black Sea wheat exports on wheat prices resulted in the 5-year average price line going below the 10-year average price line in 2016. Between 2008 and 2019, the 5-year average price range was $4.32 to $6.58, and the 10-year average price range was $3.88 to $6.04. The average annual price was $5.53.
A review of the 5- and 10-year averages prices indicate that the $5.00 wheat price should not be considered a high price. The observation may be supported by overlaying an annual wheat price chart over the 5- and 10-year price chart (Figure 2).
Using the time period 2008 through 2019, the established average annual price range is $3.44 (2016) to $7.45 (2012). The midpoint price is $5.45.
Average annual wheat prices support the conclusion that $5 wheat prices should not be considered a high price. This conclusion is probably a good one over a 5- or 10-year period. What about when the current supply and demand situation is considered?
Two major price level indicators contradict each other: world wheat ending stocks and U.S. hard red winter (HRW) wheat ending stocks. Projected record world wheat ending stocks indicate relatively low prices, and the conclusion would be that $5 is a relatively high price.
United States HRW wheat stocks are projected to be 37 percent below the 5-year average which could indicate an above average wheat price. $5 is 53 cents below the average annual price. The conclusion could be that $5 is a relatively low price.
My conclusion is that over time, $5 is neither low nor high. Given that wheat prices are mostly determined by the world wheat situation, implying that the world situation trumps the U.S. situation, $5 is probably on the high side of potential prices.
About the Author(s)
You May Also Like


