Subscribe to receive top agriculture news
Be informed daily with these free e-newsletters

A look back at past seasons tells a lot about why crops turned out the way they did.
Roger Glick records weather information every day during the growing season. He uses a simple spreadsheet. Over time, he can look back and compare one season to another.
Glick and his family operate Glick Farms near Columbus in eastern Bartholomew County. Recently he supplied weather information collected on his farm from the last three years.
He records daily high and low temperatures, computes growing degree days for that date, and records rainfall. Then he totals them up month by month. He stops recording growing degree days in October after the first true frost.

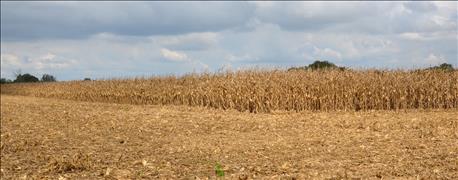
LESS-THAN-IDEAL YEAR: Some areas saw more rain than needed again this year. While it was a good year for corn, many farmers report it wasn’t as good as they expected.
If you’re not sure keeping weather data is worth the small investment in measuring instruments or the time it takes, take a look at these six points gleaned from Glick’s data for 2014, 2015 and 2016. Remember that these observations apply for his farm in Bartholomew County. Your numbers would be different. However, you might be surprised at how similar some of the trends are to what you experienced.
1. You can receive too much rainfall for top crop performance. Rainfall was plentiful in all three years. For April through October, Glick recorded 32.1 inches in 2014, 40.94 inches in 2015 and 45 inches in 2016.
If you live in north-central or northeast Indiana, you will remember 2015 as the year that was far too wet in June, in some cases leading to disastrous corn yields. Glick notes that it was actually too wet on his farm in 2016, as well.
2. When it rains makes a huge difference. That is not rocket science. But if you record daily and monthly data and compare, it’s easier to see why there is an impact. In 2015, north-central and northeastern Indiana received huge rainfall totals in May and June. Central and southern Indiana turned too wet beginning in late June. In 2015 at Glick's farm, 10.10 inches of rain fell in June, and 12.7 inches came in July. In 2016, 5.3 inches fell in June, but 11.4 inches came in July, with another 8.5 inches in August and 7.1 inches in September.
3. Temperatures in July matter for corn. Corn likes cool weather, especially at pollination time. July was a record cool month at the site in 2014. Some 643 growing degree days accumulated during the month, compared to 759 in 2015 and 776 in 2016.
4. Number of 90 degree F or higher days matters. Not one day hit 100 degrees or higher in 2016. Yet for those who want to argue that it was hotter than corn prefers in 2016, especially during grain fil, the data is there. Some 27 days reached 90 degrees or higher in 2016, just under twice what's normal. In 2014, there were only 12 90-degree days, and 2015 saw 16 90-degree days.
5. Heat can come late in the season. August 2016 featured 10 days that were 90 degrees or hotter — the highest single month of all three years. But September 2015 was second with seven — nearly half of all 90-degree days that year. Even in 2014, 25% of the 90-plus-degree days came in September.
6. When it frosts makes a difference. The growing season extended until the end of October in 2014 and into November in 2016. Frost ended the growing season on Oct. 15 in 2015. Double-crop soybeans benefit from late frosts.

You May Also Like
Enter a zip code to see the weather conditions for a different location.