Subscribe to receive top agriculture news
Be informed daily with these free e-newsletters

Crop markets are a lot like horse races: anticipation, big buildup and final result.

The Kentucky Derby is always fun to watch – lots of anticipation, a big build up, and you are never sure what is going to happen. A similar pleasure for many commodity market analysts is to watch the futures markets react on USDA report release dates.
What commodities will break out? Which commodities will be the day’s winners and losers? Fortunes can change in seconds.
August 11th was an interesting day for USDA report watchers. The USDA released Crop Production and WASDE reports at 11 am CST and FSA Crop Acreage Data at 12 pm CST.
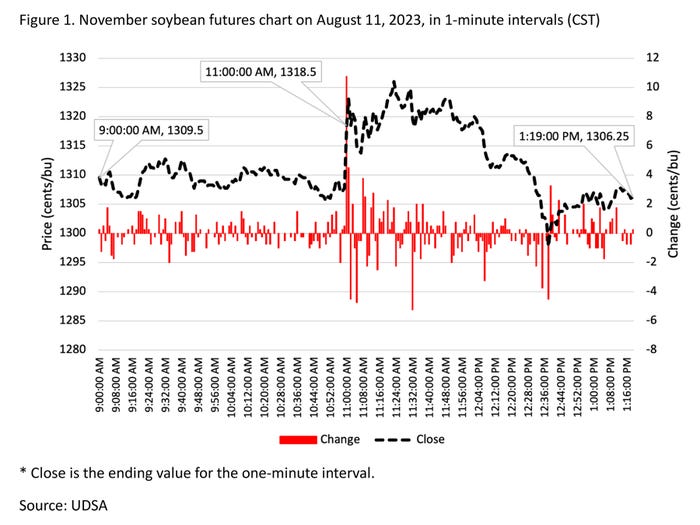
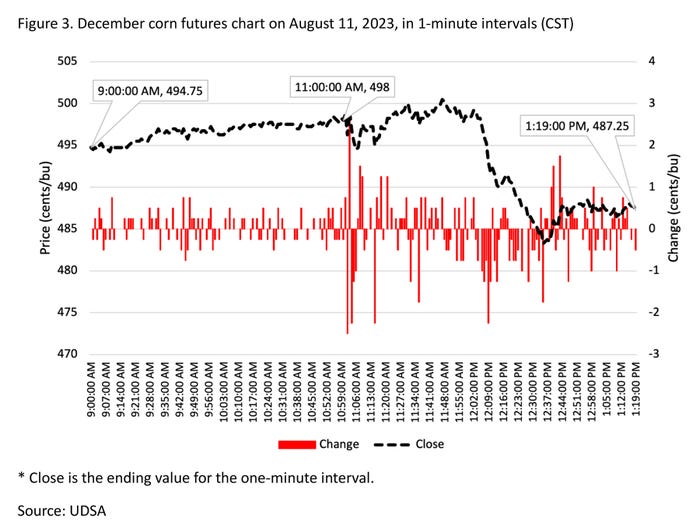
The 11 am release precipitated soybean markets increasing 10.75 cents (Figure 1); cotton markets increasing 1.92 cents (Figure 2); and corn markets increasing 0.25 cents, before moving up 0.75, down 2.5, up 2.75, down 2.25, and down 1.25 cents in the next five minutes (1-minute intervals) (Figure 3).
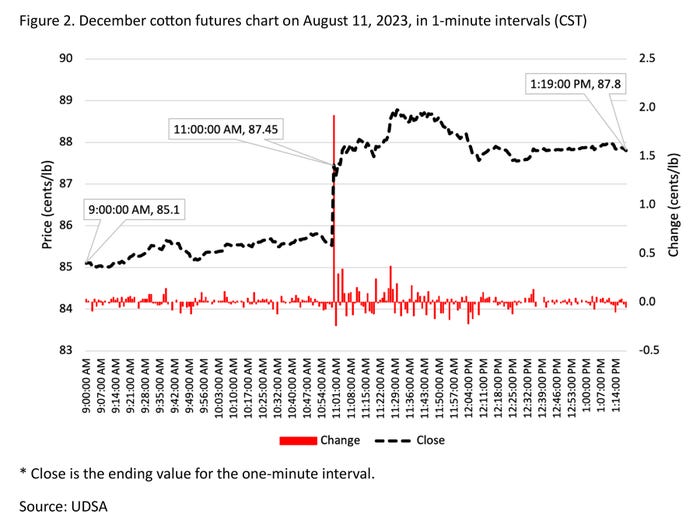
The movement in December cotton futures price is the easiest to explain. A projected average national upland cotton yield of 773 lbs/acre and harvested acres of 8.51 million, resulted in a projected decline in U.S. production of 2.51 million bales and lowered ending stocks 700,000 bales compared to last month.
Additionally, foreign stocks decreased 2.22 million bales. The result was December cotton, opened at 9:00 am at 85.1 cents and closed the day at 87.8 cents.
November soybean futures also received a report bump in prices but were unable to hold the majority of the initial price gains.
Soybean prices reacted positively to the 1.1 bu/acre reduction in national average yield and the 55-million-bushel decline in U.S. ending stocks. However, conspicuously absent from USDA estimates were modifications to Brazil and Argentina production, exports, and domestic use.
A lack of modifications to South America likely assisted in the reduction of prices throughout the rest of the trading day.
As mentioned above, December corn futures had a more muddled reaction.
U.S. national average yield was within pre-report expectations at 175.1 bu/acre. Compared to last month, U.S. ending stocks were down 60 million bushels and foreign ending stocks were down 62 million bushels. U.S. feed and residual use, exports, and food, seed & industrial use decreased a combined 95 million bushels.
The national average yield created some consternation in markets. This was USDA’s first survey-based yield estimate for 2023.
There remains a great deal of uncertainty due to the uneven distribution of drought geographically and over time during the growing season. As of August 8th, 49% of corn production was in drought, however extreme or exceptional drought was limited to 6% of the production area.
The national average corn yield remains an enigma, and that is reflected in market movements.
Source: Southern Ag Today
You May Also Like
Enter a zip code to see the weather conditions for a different location.