June 5, 2015

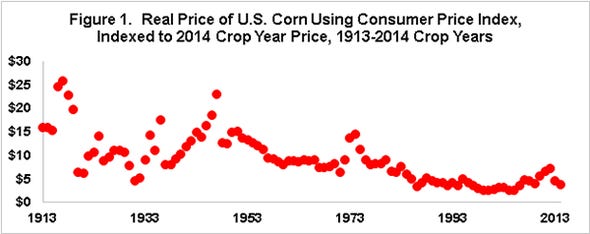
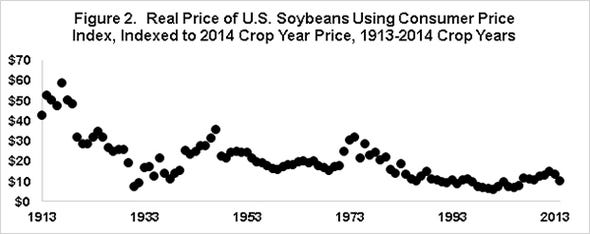
Experts at the University of Illinois went back 100 years and examined corn prices, soybean prices and wheat prices, then divided them by the Consumer Price Index. In doing that, they found that real prices for 2014 corn and soybeans are $3.65 and $10.05, respectively. This compares to 1913 real prices of $15.76 for corn and $42.80 for soybeans. See the effect of history on these commodity prices.
As Figures 1 and 2 reveal, real prices of corn and soybeans, and wheat trend steadily lower over the last 100 years despite farm policy intervention and intermittent multiple-year increases. The later occurred in the early-to-mid-1930s due to drought and a rebound from the Great Depression, during and after World War II due to demand and U.S. policy, the 1970s due to exports and global production problems, and more recently due to food and biofuel demand, and global production problems. The long term decline reflects a simple story: supply expands faster than demand. Thus, prices work lower to stimulate demand and dampen the increase in supply.


1970 vs. 2000 prosperity
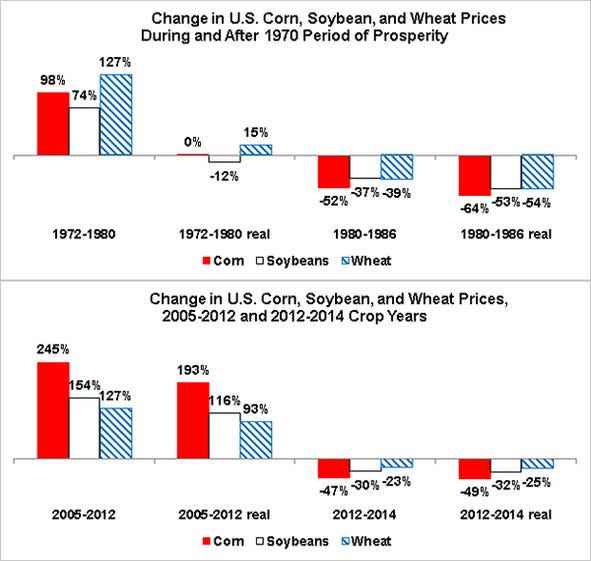
While too early to be certain, let's assume the recent prosperity period ends in 2012. If so, notable differences exist in price changes during the 1970 and 2000 prosperity. Most strikingly, real prices changed little between 1972 and 1980 (see graph) as general price inflation offset higher nominal, or observed, crop prices. In contrast, between 2005 and 2012, real corn, soybean, and wheat price increased 193%, 113%, and 93% (see graph).
 These price increases underscore the importance of corn in the 2000 prosperity, likely due to biofuels, but also the low level of general price inflation. CPI increased 93% from 1972 to 1980 but only 18% from 2005 to 2012. After 1980, nominal prices bottomed in 1986, with a total decline of 37% to 52%. Real price decline is larger, 53% to 64%, reflecting general price inflation. In comparison, 2014 crop year prices of corn, soybeans, and wheat are 47%, 30%, and 23%, lower than in 2012. While the decline since 2012 is sizable, it is nowhere near the increase in nominal observed or real prices since 2005.
The key question is: Can food demand growth drive crop, more broadly, farm real prices higher? History is not kind. For as long as price records exist, including this 100-year record, food demand growth has not been enough to offset the increase in supply of farm products, resulting in downward pressure on prices.
While historical trends do not always hold, absent strong arguments to the contrary, the default position is that real U.S. crop prices are likely to trend lower. More succinctly, unless general price inflation increases, supply growth declines, or multiple year global supply disruptions occur; the question is not if but when will corn crop year average price average below $3 and push toward $2. In such an environment, traditional managerial concerns of production efficiency, conservation of cash, and maximizing tomorrow's chance to farm dominate.
Read about the long-term price perspective from University of Illinois.
You May Also Like


