Subscribe to receive top agriculture news
Be informed daily with these free e-newsletters

Analysis: Why couldn’t the yield monitor also display profit and loss on the screen?
October 1, 2018
By Howard Doster
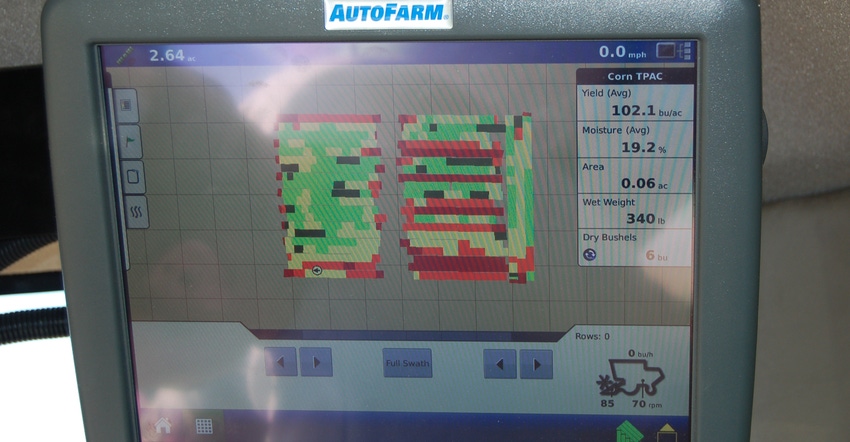
Eighteen years ago, at a session of the Purdue University Site-Specific Farming Committee, I asked this question: Why couldn’t we have the yield monitor display profit and loss on the screen besides yield? Soon after, I retired and forgot about the idea. Now, I ask that question again.
A profit color map helps you do what you’ve been doing with your yield color maps but goes one more step. Red could be for sites you don’t want to plant next season, unless crop prices increase, input prices decrease or you’re able to take corrective action.
Why? Past production performances are the best indicator of future production performances. However, prices and price relationships change, possibly causing a new best recipe. Unless crop prices increase, input prices decrease or you use a different crop recipe, you don’t expect to more than cover your variable costs on these red sites.
Various shades of green, say by $10 or $20 or $40 bands, could represent better sites. You may also want to take corrective action, including using a different crop recipe, on these sites.
I envision these green and red colors being based on your own data. If you do a budget for not planting a site, consider if you will plant grass you don’t need to mow.
Flesh out idea
I don’t propose estimating per-acre total costs — it’s not necessary. Plus, allocating overhead is often misleading. Instead, I calculate “contribution margin” and call it “contribution margin profit.” It’s like gross profit or gross margin. It’s the dollars available to cover or more than cover rent, labor, family living, machinery age loss value, interest and insurance.
Contribution margin profit would be expected revenue from sales and government payments minus variable costs for seed, fertilizer, pesticides, fuel, repairs, operating interest and machine use loss in value. It’s time we began including machine use loss in value as a variable cost. If not used, a machine appraises for more.
I use asset-appraised values as I calculate my financial balance sheet. Except for income taxes, I don’t prepare an income statement period report. If I want a period report, I calculate the difference between two of my balance sheets.
The software could create a color map for both operator and owner for each of multiple lease types. If we had the operator’s budget and/or other’s research data for each soil type, someone could estimate expected contribution profit color maps.
Once someone programs the software, I and others will want to use it on a desktop or elsewhere. We’ll want to lay the actual color maps over the expected color maps as we try to explain differences.
Outsiders, if they’re not now doing this, will want to use versions of the software. As they estimate rents, in addition to calculating per-site contribution margins, prospective tenants and rural appraisers will want to add software to figure the best way to lay out crop rows to estimate the time to do field work. The Farm Service Agency already bases Conservation Reserve Program payments on soil types. It might switch to using this process.
Doster is a professor emeritus in Purdue University’s Agricultural Economics Department. Soon after he penned this article, John Deere and Granular announced they were releasing Profit Maps. The concept is similar to what Doster proposes but appears to base the display on aggregated data.
You May Also Like
Enter a zip code to see the weather conditions for a different location.