January 15, 2019

For the fifth consecutive year, 2019 is forecast to break a record for U.S. pork production. And it’s not just more pork, it’s total red meat and poultry. Beef producers have expanded aggressively. Beef production in 2019 should surpass the record set in 2002. Total poultry production has set records the last six years, and 2019 will likely be the seventh. Prices going forward will either depress, or promote, further growth within each respective industry.
These record supplies underscore how important demand will be in determining 2019 livestock and poultry prices. So far, for pork, demand appears to be more than keeping pace with rising production. The market expects this strength to carry into 2019. Evidence of expectations of robust demand for U.S. pork, from both domestic and foreign consumers, is implicit in 2019 CME lean hog futures contract prices. On average, the 2019 contracts are trading higher than where the same contract months for 2018 expired at, even though pork production is expected 2% to 3% higher in 2019.
Largest December inventory since WW II
The Quarterly Hogs and Pigs report issued by USDA’s National Ag Statistics Service on Dec. 20 showed the highest Dec. 1 inventory of hogs and pigs since 1943. The inventory of all hogs and pigs was 74.55 million head, 1.9% higher than on Dec. 1, 2017.
Producers have been expanding since 2011. Early in the decade rising domestic and foreign demand for pork fueled profits. Solid earnings accelerated breeding herd inventory growth in 2014, 2015 and 2016. Producers invested capital in new facilities to boost volume and capture more profit. Rising production from new facilities further accelerated inventory growth.
Slow down or data glitches?
Interestingly, the September-November 2018 pig crop, which was derived from record litter rates and sows farrowing that were 1.8% higher than a year ago, did not yield an even larger pig crop number. The September-November 2018 pig crop was 33.978 million pigs, up 2% from a year ago.

For the last several quarters actual sows farrowing has been larger than the previously estimated farrowing intentions. This was not the case for this quarter, as 5,000 fewer sows farrowed than were projected by the September report and 22,000 fewer than were projected by the June report.
The Hogs and Pigs survey asks producers how many sows and gilts are expected to farrow in the next two quarters. It is certainly possible some producers chose not to fully follow through on their earlier stated intentions.
Every December, USDA reviews the quarterly reports for the year. It could also be the case that this review led to recalibration of the sows’ farrowing estimates and, going forward, the farrowing intentions will be better predictors.
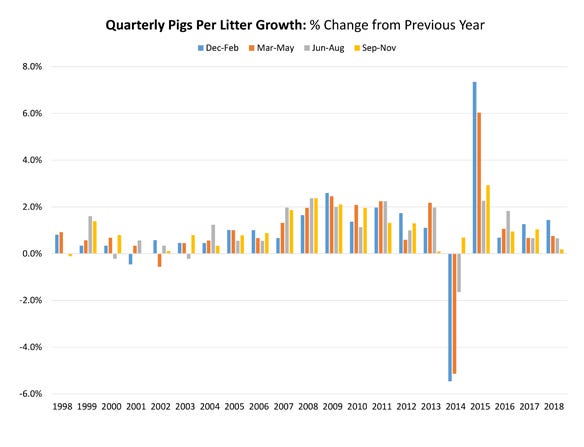
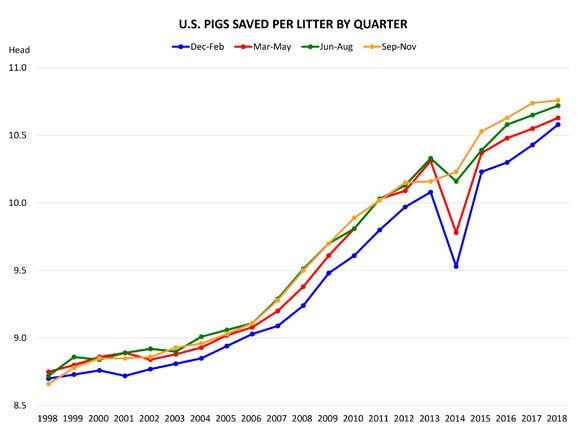
The productivity piece driving the September-November 2018 pig crop is pigs saved per litter. While this estimate of 10.76 pigs was record large, it was only 0.2% higher than a year ago. This was the smallest year-over-year rise since PEDV brought annual decreases in 2014.

The September-November 2018 litter rate growth more closely resembles the annual increases back in the late 1990s and early to mid-2000s. Litter growth rates have been below 1% each of the last three quarters in 2018, a step back from the 1% to 1.5% growth the last couple of years.
Gilt retention could be a factor
Litter size is usually smallest in the first litter, rises to a maximum between the third and fifth litter, and then remains constant or declines slightly with older parities. Gilt retention has been a topic of discussion in the industry, and anecdotal evidence suggests producers are indeed holding back more gilts.
The previous Hogs and Pigs reports in 2018 implied a notable increase in gilt retention. These gilts now being introduced into the breeding herd could be slowing down litter rate growth in the short-term.
Operation size has been shown to impact litter size. Pigs per litter by size of operation depicts the ability and efficiency of different-sized operations to produce pigs. Smaller operations tend to have smaller litter sizes, and larger operations that are more efficient produce larger litters. For the 2017 production year, the average pigs saved per litter was 10.59. Pigs saved per litter by size of operation ranged from 7.85 for operations with one to 99 hogs and pigs to 10.65 for operations with more than 5,000 hogs and pigs.
Starting in March, the pigs per litter by size of operation data was discontinued as part of the Hogs and Pigs report. Thus, we are unable to dissect if the slowing litter rate growth, on average in 2018, is operation size-specific or is an industrywide occurrence.
The Hogs and Pigs report provides quarterly pigs per litter estimates for the 16-major hog-producing states. The report also aggregates the remaining 34 states (labeled “Other states”) to comprise the U.S. average. The September-November 2018 litter rate declined in Colorado, Illinois, Michigan, Minnesota, Nebraska, North Carolina, Ohio and Oklahoma compared to one year ago. Colorado had the largest year-over-year decline at 5.9%. The Iowa pigs-saved-per-litter estimate increased 0.4%, which was similar to the U.S. average increase of 0.2%.
The slowing rise in litter rates in 2018 is no indictment of productivity efforts. Many factors could slow rate of growth in the number of pigs saved per litter, including production system changes, genetics, disease incidence, labor issues and weather implications of when the sows were bred. This is a number to watch to see if this is a short-term event or something that continues.
Schulz is the ISU Extension livestock economist.
About the Author(s)
You May Also Like


